
Warehouse Usage
A page for usage metric on snowflake warehouses
The Warehouse usage page gives you a clear view of your Snowflake consumption without having to write SQL against Snowflake's account usage views. Use it to:
- Track how many credits you've used (and been billed for) over any time period
- See which warehouses, users and service categories are using the most credits
- Find the specific queries that cost the most, so you know where to optimise
- Spot when your warehouses are busiest across the week
Summary
Shows how many credits you use and what drives the spend.
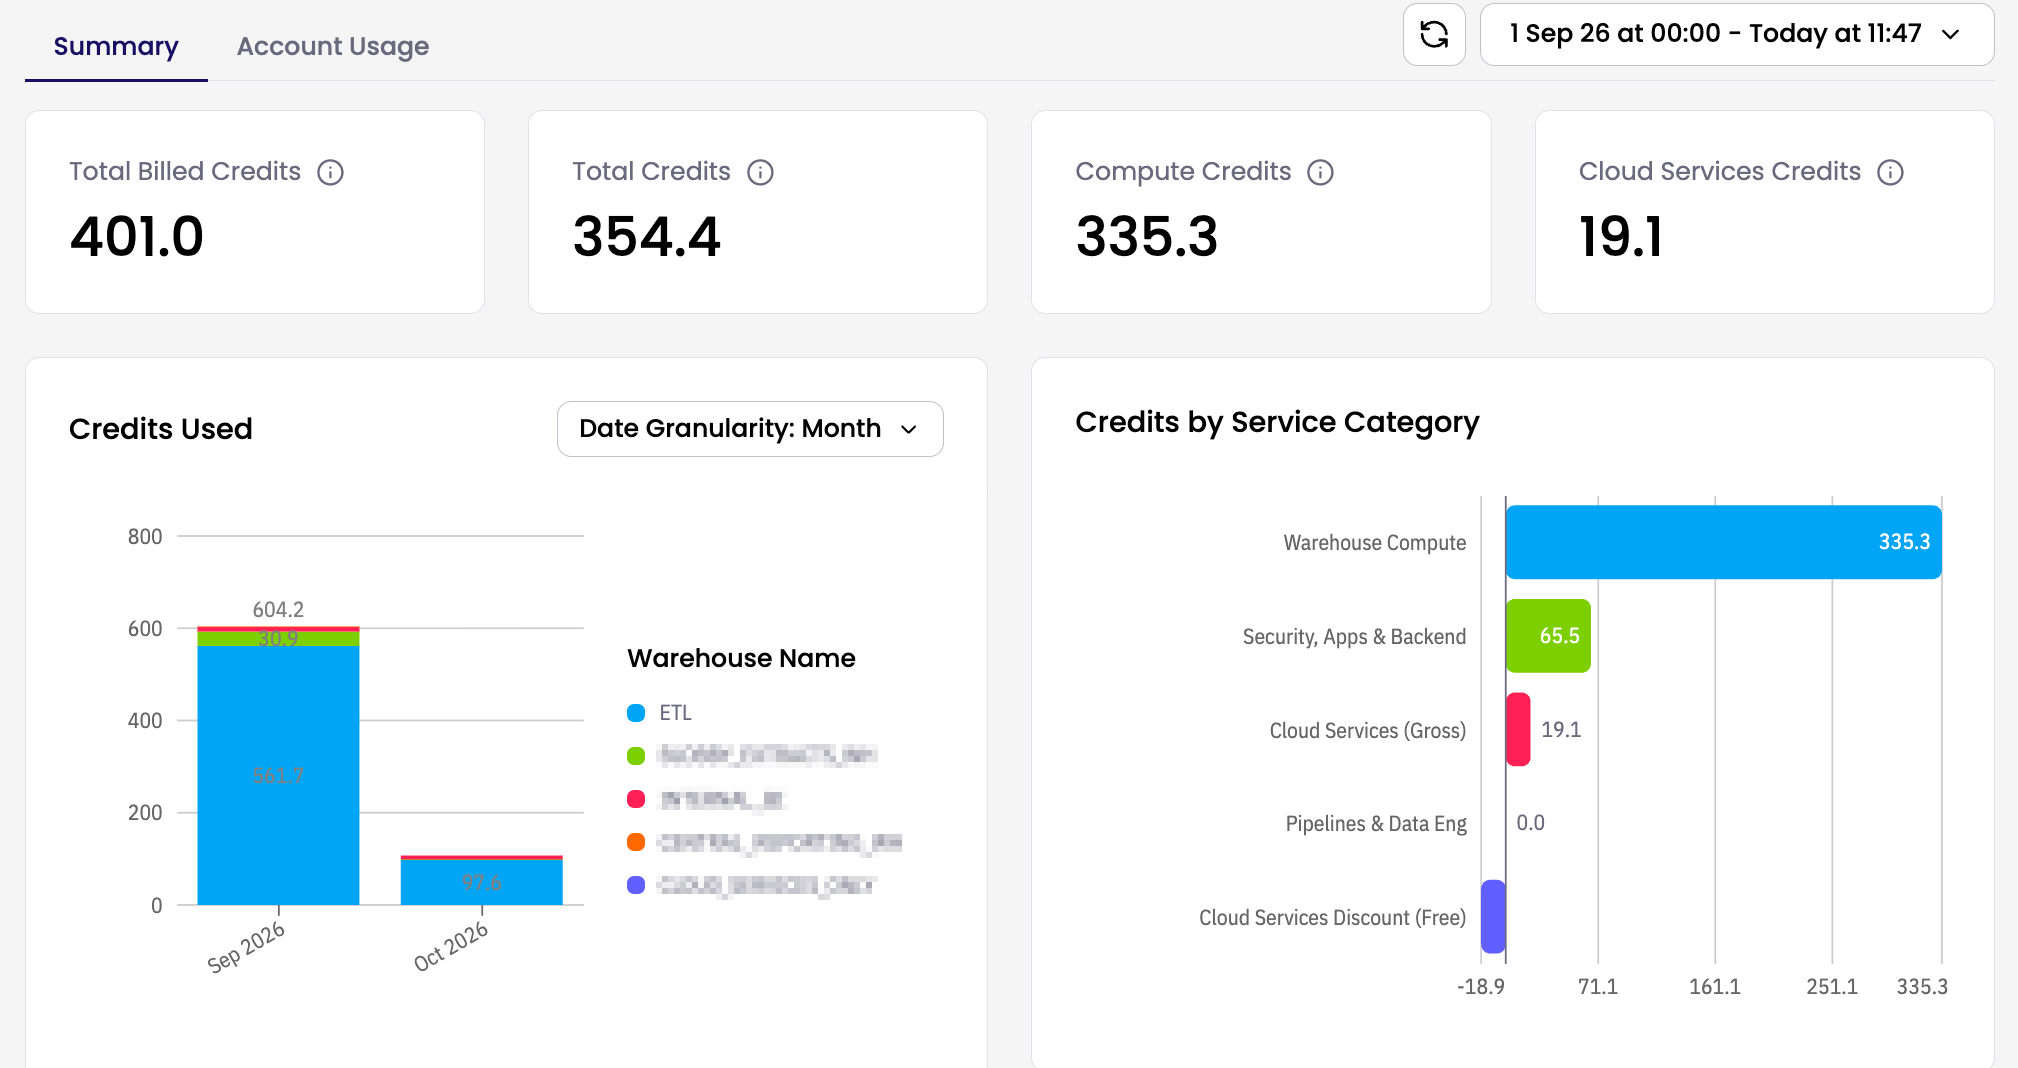
- Total Billed Credits: closest to your Snowflake invoice; includes compute, cloud services after discounts, and additional services such as AI and backup.
- Total Credits: compute plus cloud-services adjustment; excludes additional services.
- Compute Credits: warehouse usage for queries and workloads.
- Cloud Services Credits: background services, charged only above the applicable threshold.
- Credits Used: trends over time by warehouse.
- Credits by Service Category: shows which Snowflake services drive spend; discounts may appear as negative values.
- Credits by User and Warehouse: highlights the biggest consumers.
Account Usage
Identify costly queries and opportunities to reduce warehouse spend.
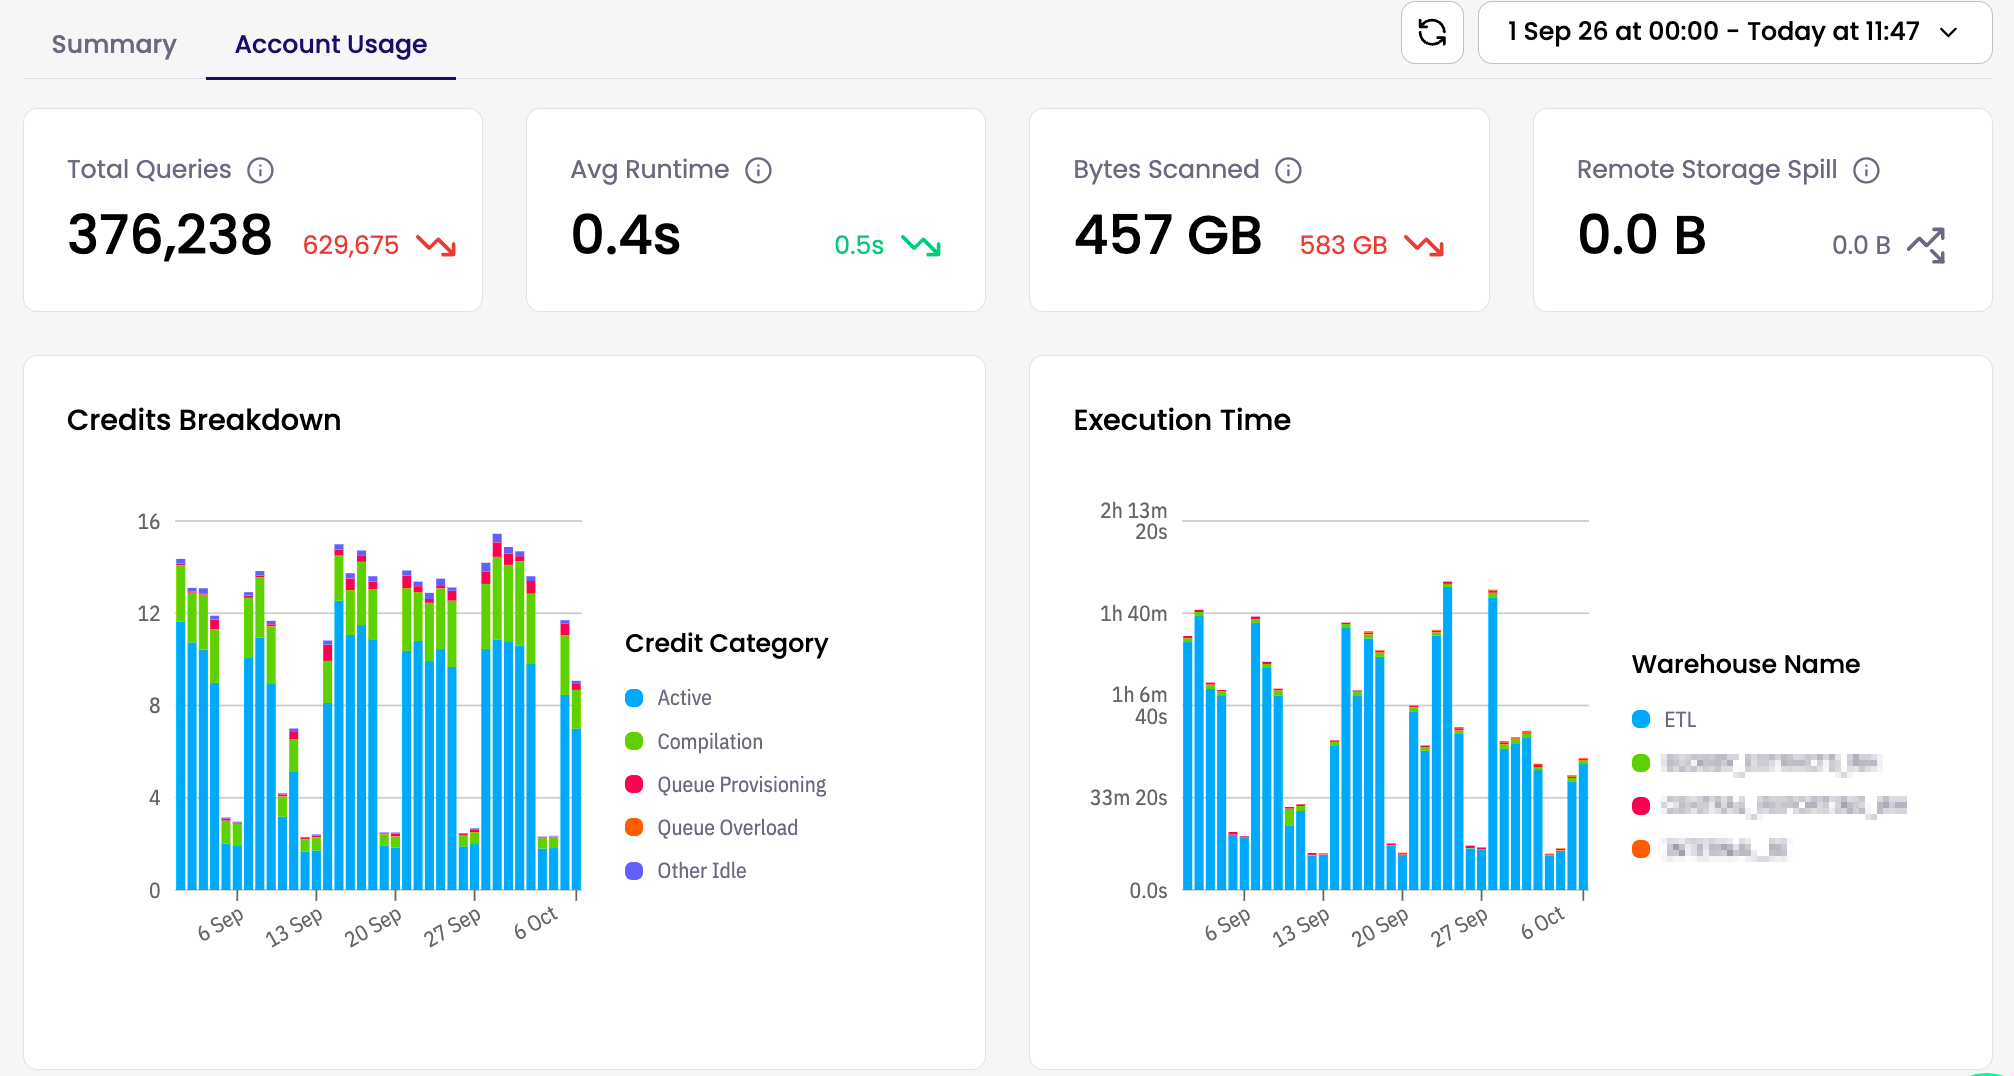
- Query metrics: total queries, average runtime, bytes scanned and remote storage spill. Spill should ideally be 0 B; optimise affected queries or consider a larger warehouse.
- Credits Breakdown: shows active, compilation, queue and idle usage. High idle usage suggests reviewing auto-suspend; high queue overload suggests capacity pressure.
- Execution Time: shows daily query runtime by warehouse.
- Query filters: narrow the query summaries, charts and cost table by query type, warehouse, user and Top N query shapes (similar query patterns grouped together).
- Frequency vs Cost: prioritise queries that run often and consume the most credits. Optimise expensive runs or reduce unnecessary frequency.
- Credits by Query Type: shows which statement types drive spend.
- Higher Cost Queries: ranked by total credits burned. Start with the highest-cost shapes; compare credits per execution and bytes spilled to identify fixes.
Updated about 1 hour ago
Did this page help you?