Data Docs
Introduction
Data Docs is a great tool for users of Kleene to understand the details of each transform in one place, useful for when you onboard a new Analyst.
Select a transform from the hierarchy and you can easily see - execution times, creation details, a description of the transform, schedule, input and output tables as well as the SQL code.
You can also jump the transform for further code editing or to the DAG.
Click on Data Docs in the Model menu, select a group then a transform to start.

Select a transform
Name and Status
This gives you the same information as the statuses elsewhere in the system, when the transform was last run and how long it took.
Clicking on the green buttons will take you to the transform for further editing or to its location on Pipelines.

Name and status
Details
Information on when the transform was was created and last edited, and by whom.

Details
Description
Information entered by a user in the Description box on the transform editing page. Typically, it's used to explain what the SQL code is doing.

Description
Schedule
Information on when the transform runs according to the transform or group schedule.

Schedule
Input tables
Information on what tables feed into the transform, extracted from the SQL.

Input tables
Output tables
Information on where and what the output of the transform is, including the columns and the column type. Multiple output tables are sometimes generated from a transform.

Output tables and columns
SQL
This is the code that the transform runs in production. To copy the code and reuse it somewhere else, click the Copy icon, which stores it in the clipboard.

SQL code
Tags
Information on the tags that have been added to the transform by the Analyst. These are searchable.
Feature Requests
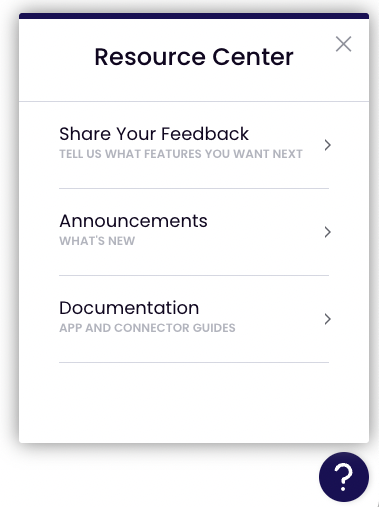
To suggest a new feature go into Resource Center, Share Your Feedback and add a suggestion.

Updated 3 months ago
