Data Quality
Unit Test Results
Introduction
The Unit Test Results Dashboard presents a number of visualisations from the table PROD.KLEENE.UNIT_TEST_LOG. This unit test log table is populated with an entry whenever a unit test within a transform is executed. There may be a delay of up to one hour between a test populating the table and the result being visible on the Unit Test Results dashboard.
Warehouse Error: query failed
This error will be displayed in place of any visualisation if the table PROD.KLEENE.UNIT_TEST_LOG does not exist. To create this table follow these instructions
Dashboard Unavailable
This error will appear in place of the dashboard if Unit Test Results haven't been configured in your account. Please contact support if you would like it to be configured.
Visualisations
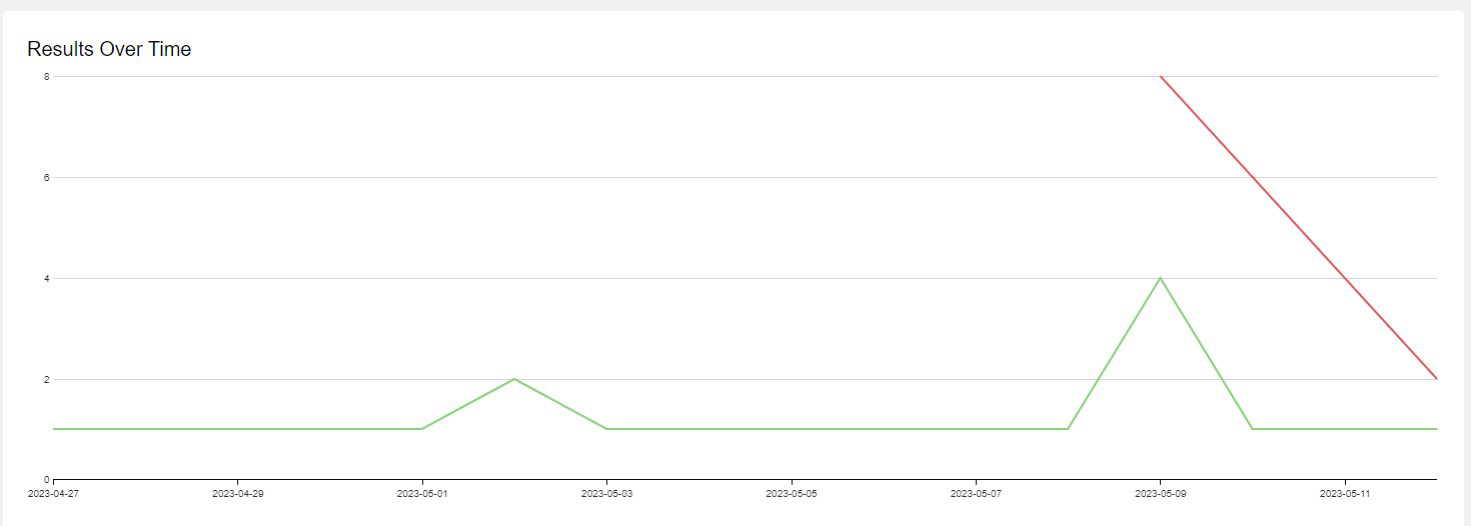
Results Over Time
The x-axis presents every day between the present day and the value of Tests Since in the dropdown filter. The y-axis presents the number of tests. The green line represents tests where the result evaluated to true (successful tests). The red line represents tests where the result evaluated to false.

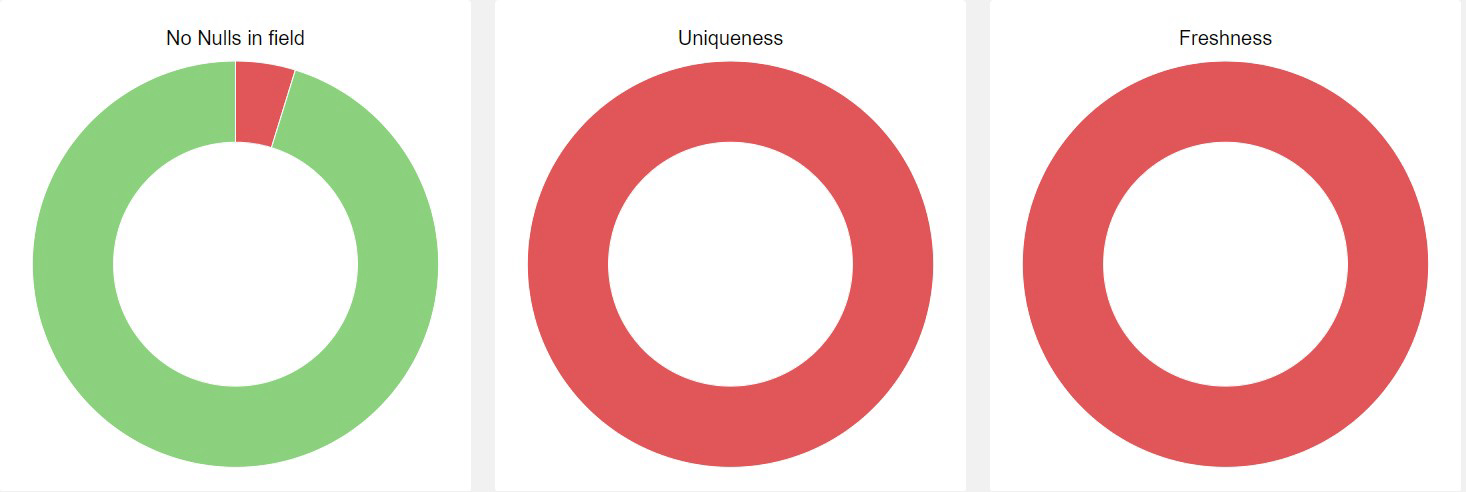
Donut Charts
The Donut charts present the proportion of tests where the result evaluated to true (green) compared with false (red) for each test type. All test between the present day and the value of Tests Since in the dropdown filter.

Table
The table presents all the information captured about all tests between the present day and the value of Tests Since in the dropdown filter.

Filters
By default the dashboard presents results for all unit tests in the past week. The dashboard can be filtered in the following ways:
- Only show tests on certain tables in the warehouse by filtering on table, schema, database.
- Only show certain test types; No Nulls in field, Uniqueness, Freshness
- Only show certain results; True, False
- Alter the timeframe to show tests between any selected date and the present day
Updated 6 months ago
