
Overview
A monitoring dashboard that provides visibility into connector and transforms health
Introduction
This feature provides comprehensive visibility into connector health, data extraction activities, and transformation operations across your data pipelines. The dashboard presents key metrics, real-time statistics, and actionable insights. You can quickly assess the health and performance of your data pipelines, identify issues such as slow-running transformations, and make informed decisions about optimisation and resource allocation.
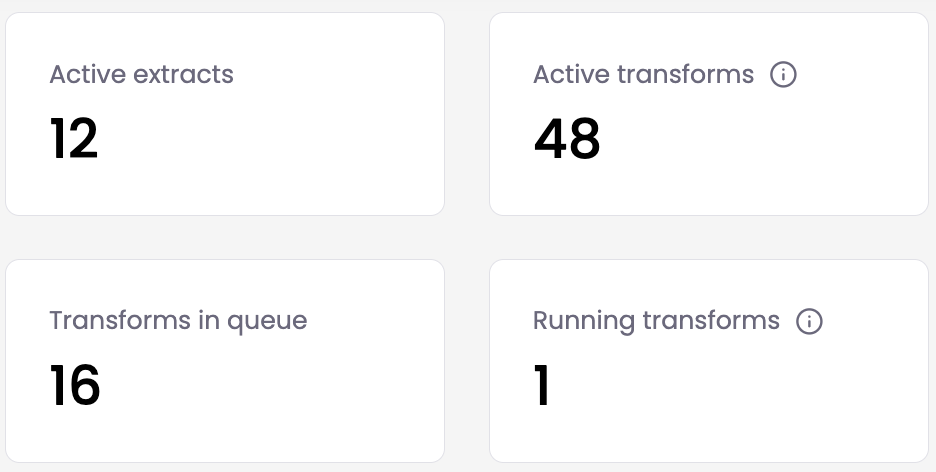
Summary Overview Panel
The summary overview panel is designed to give an overview of active extracts, active transforms (schedule and non-scheduled), transforms in queue and running transforms.
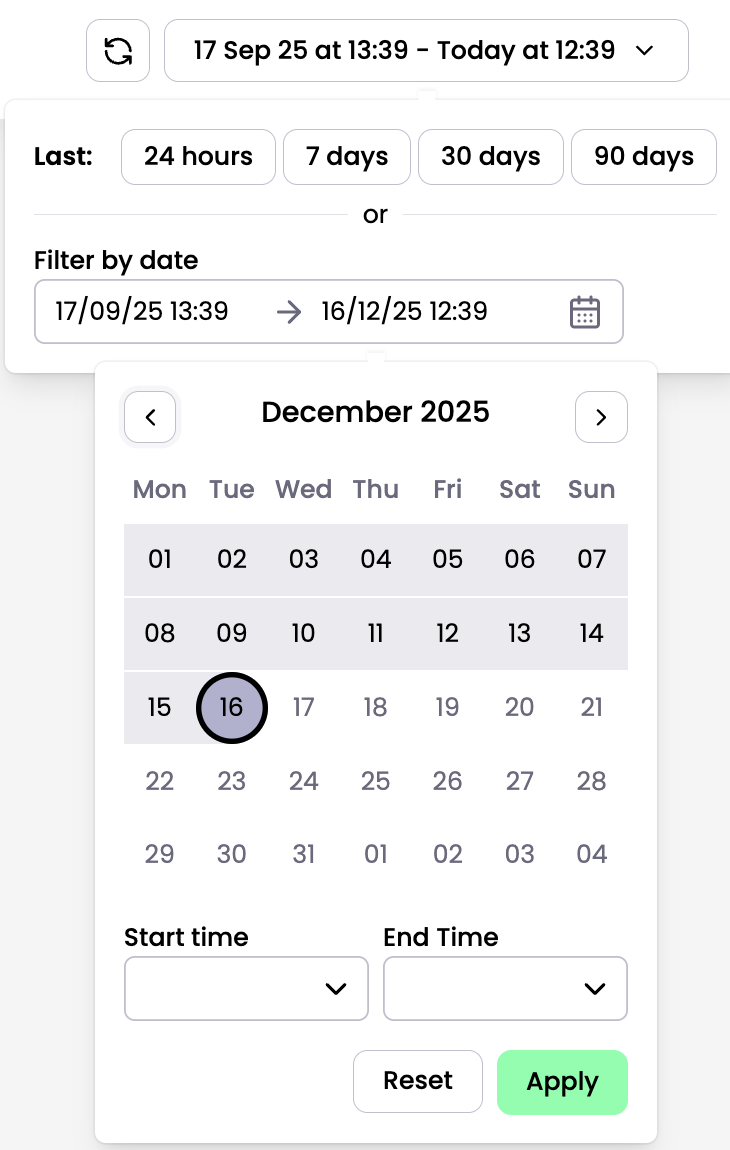
You can filter the content on this page using preset day options or by selecting a custom date range.
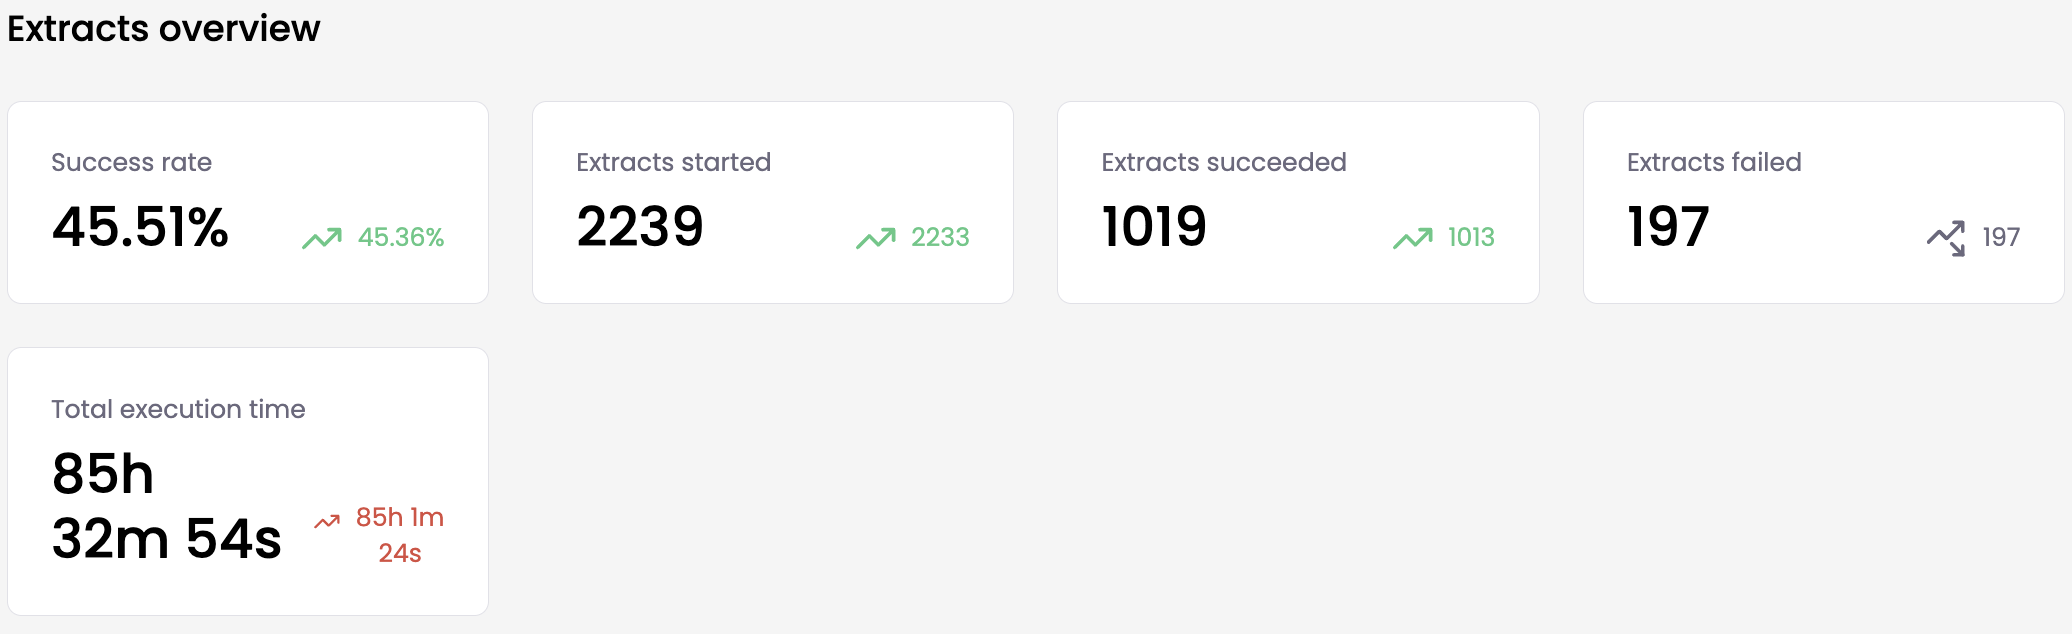
Viewing Extract Overview
The dashboard displays the success rate, number of extracts started, extracts succeeded, extracts failed and total execution time
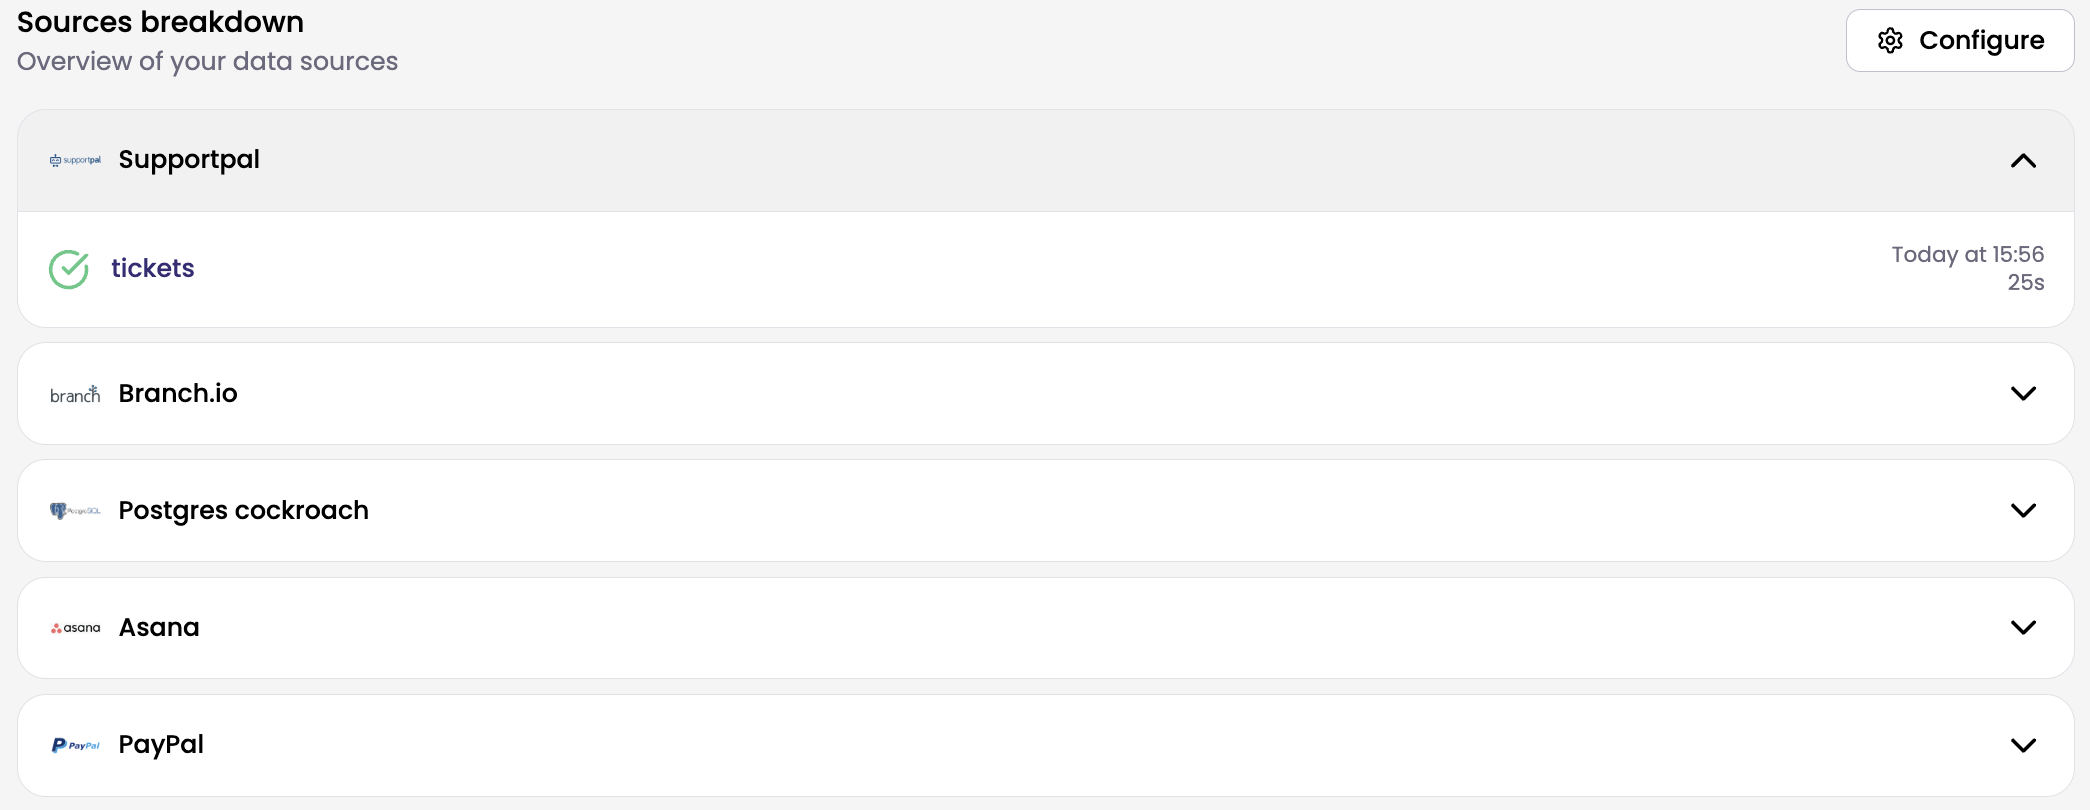
Configuring Your Extract View
You can customise which sources appear on your dashboard:
- Click the Configure button to select up to 5 sources to monitor
- Add, replace, or remove sources as needed
For each configured source, you'll see the Last 5 extracts, Status indicators, View all extracts link.
The extracts chart shows the total number of data extracts over time. Filter the chart by time range and view breakdowns of successful versus failed extracts with colour coding. Hover over any data point to see exact counts.
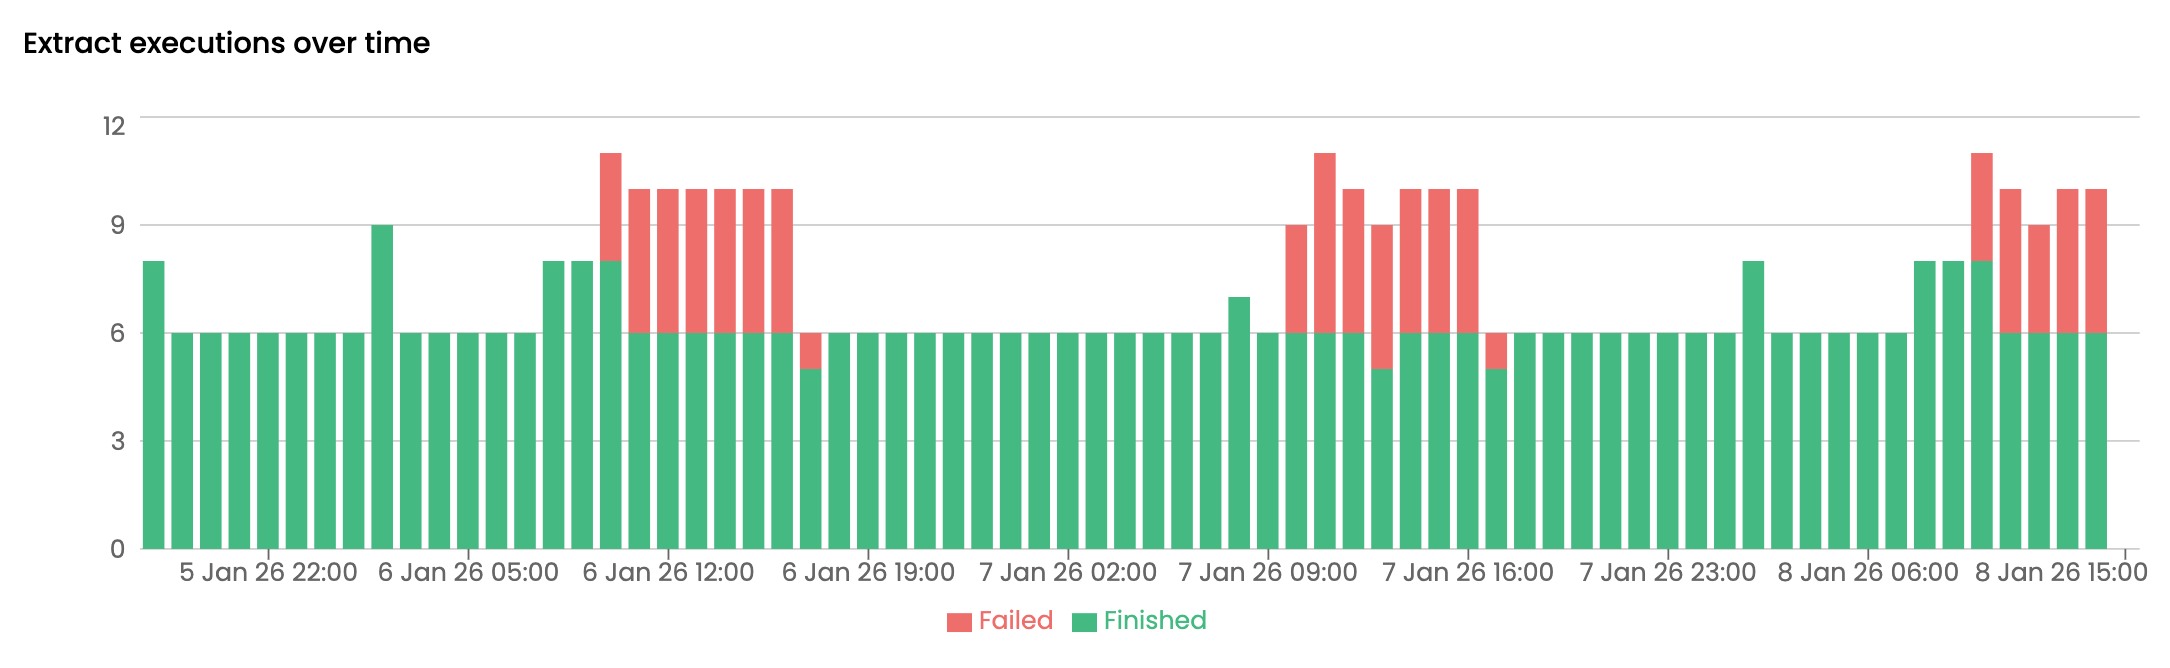
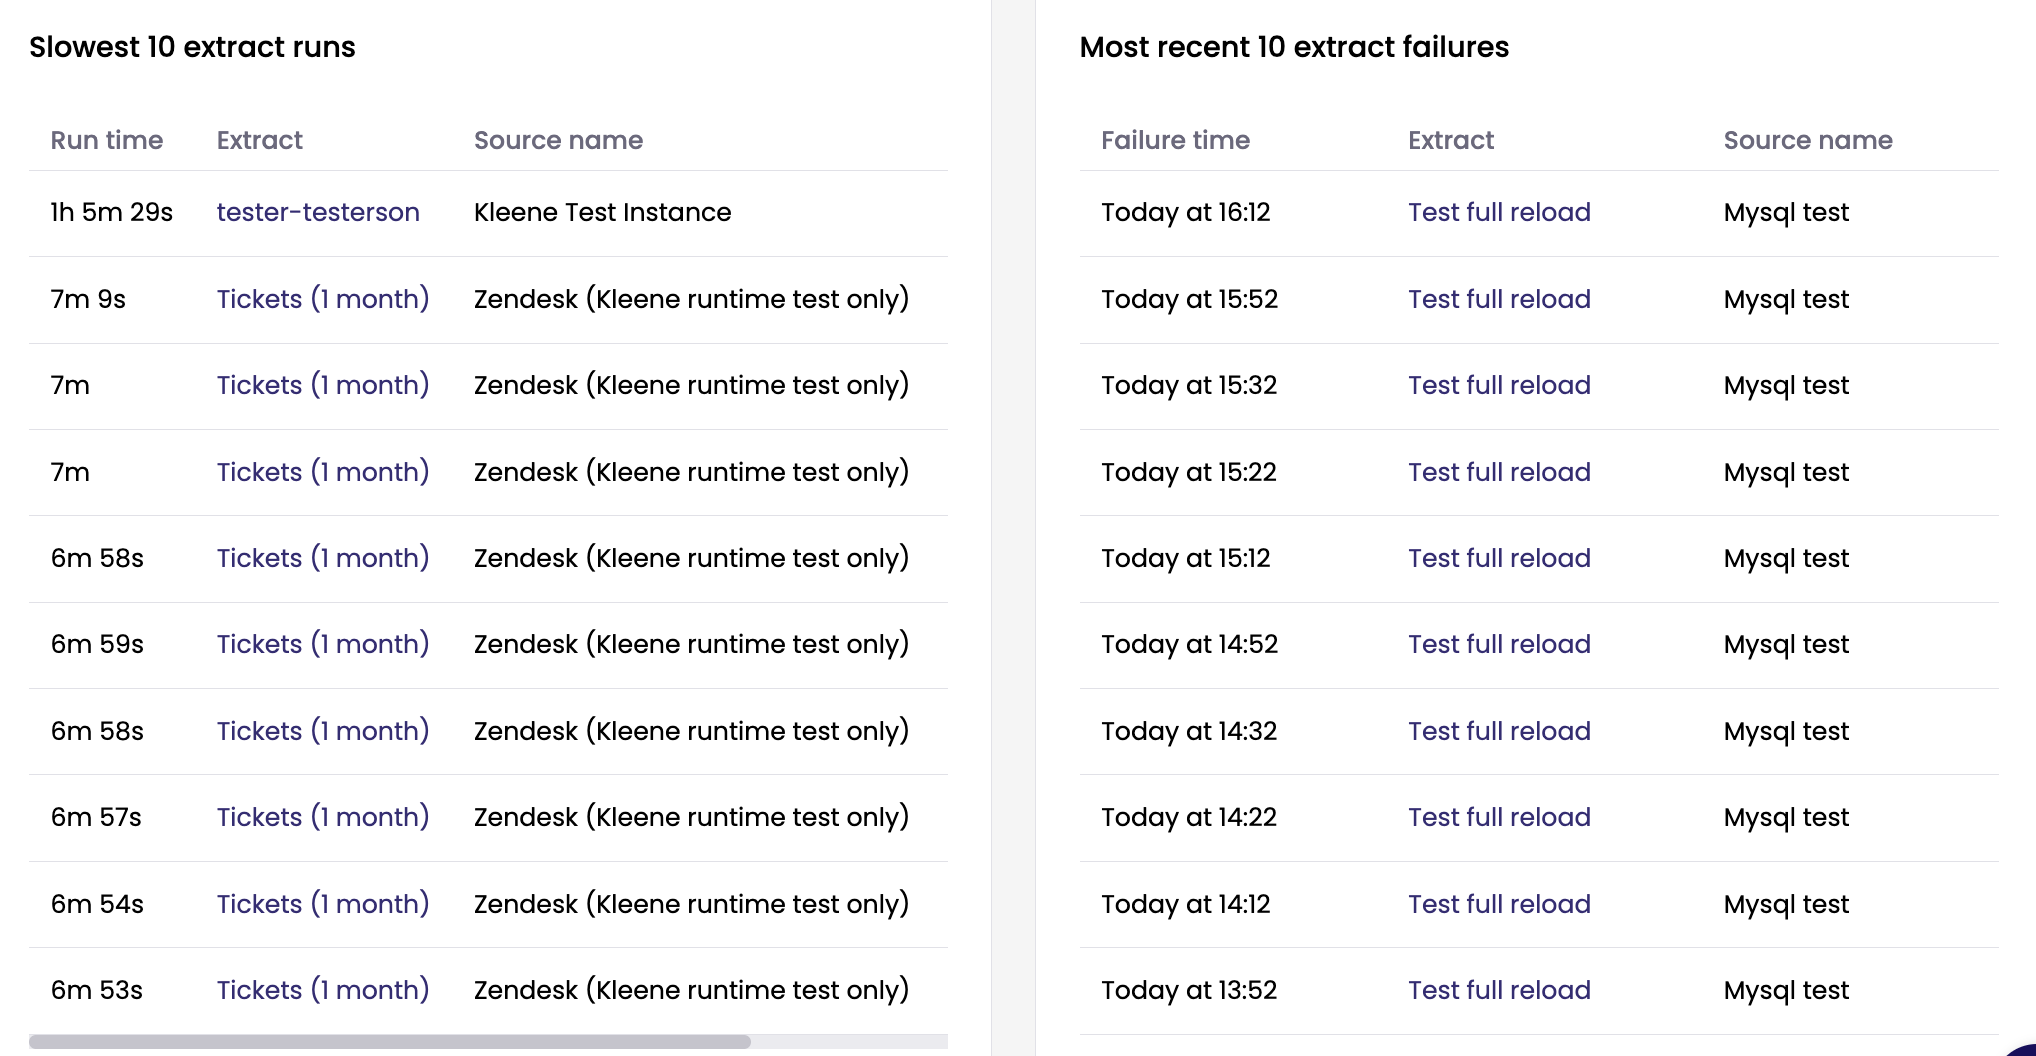
Below the chart, you'll find lists of the most recent failed extracts and the top 10 slowest-running extracts for the selected time period.
Viewing Transform Overview
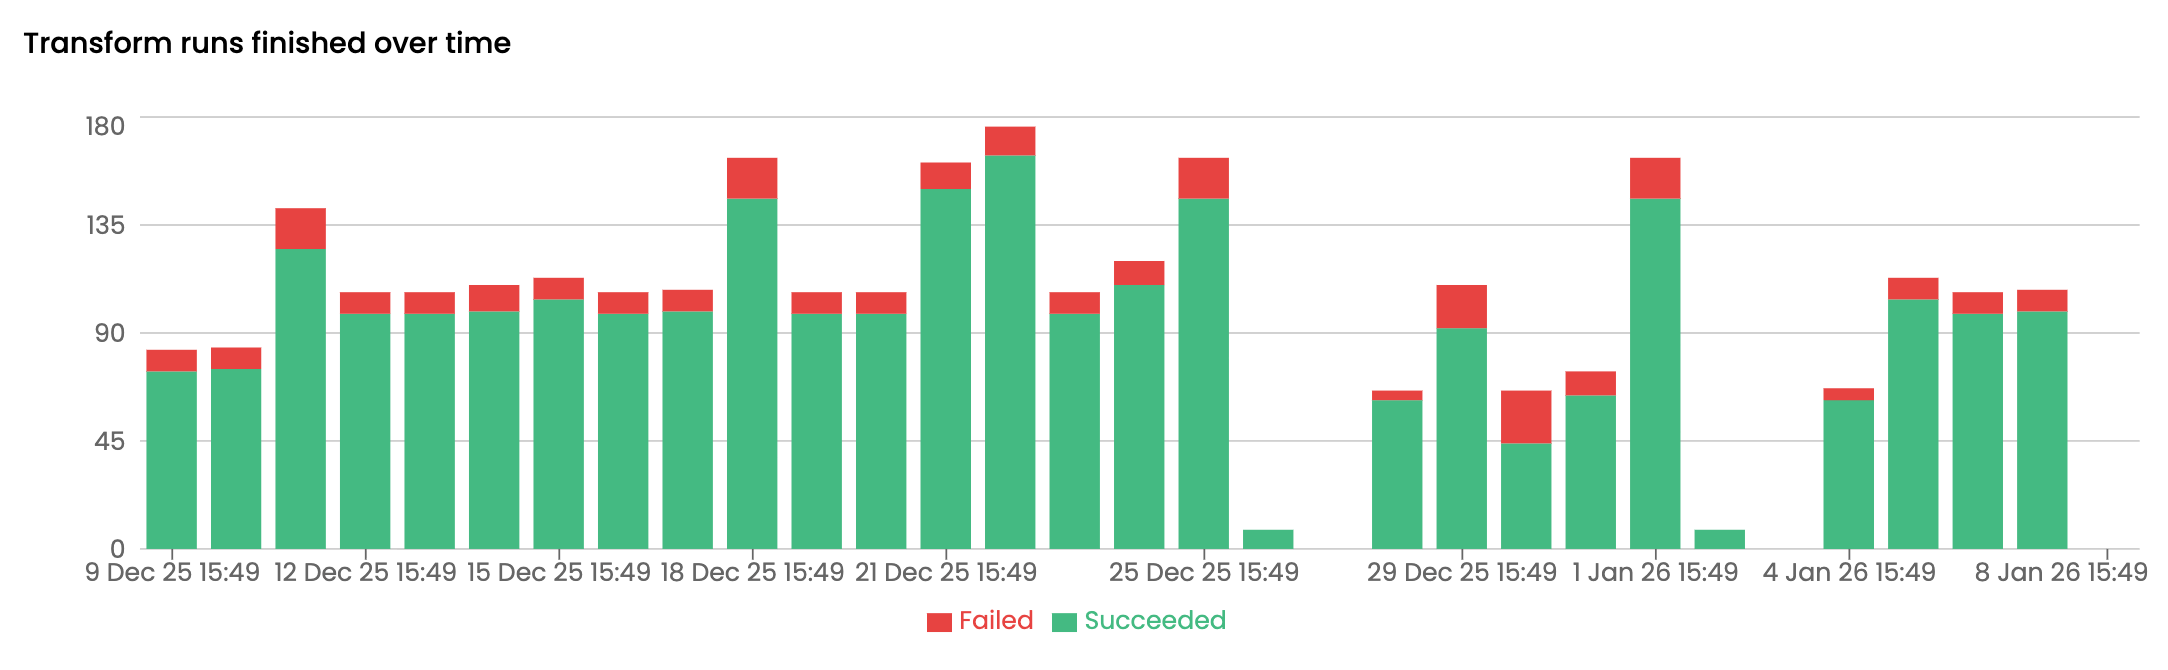
The transforms chart displays the total number of data transforms over time. You can filter the chart by time range and view breakdowns of successful versus failed transforms using colour coding. Hover over any data point to see exact counts.
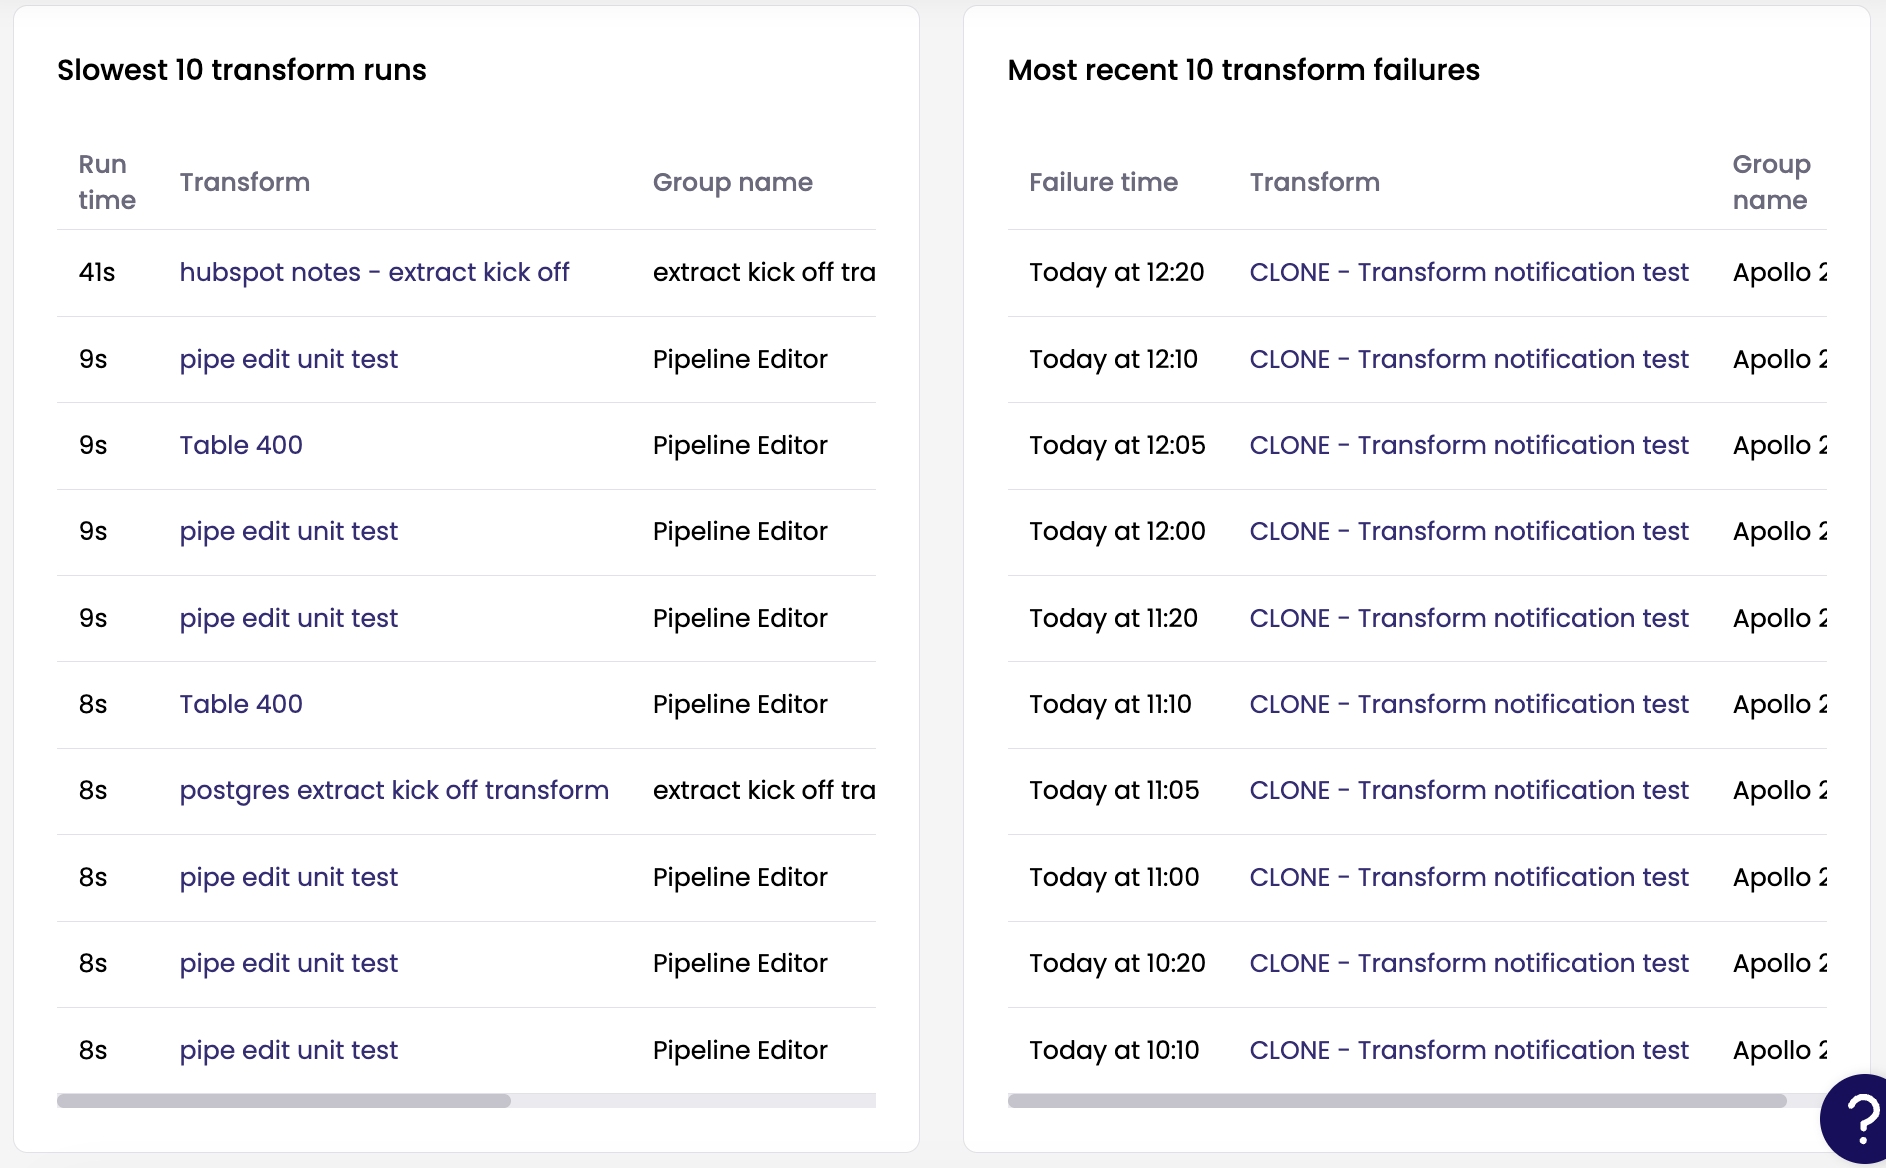
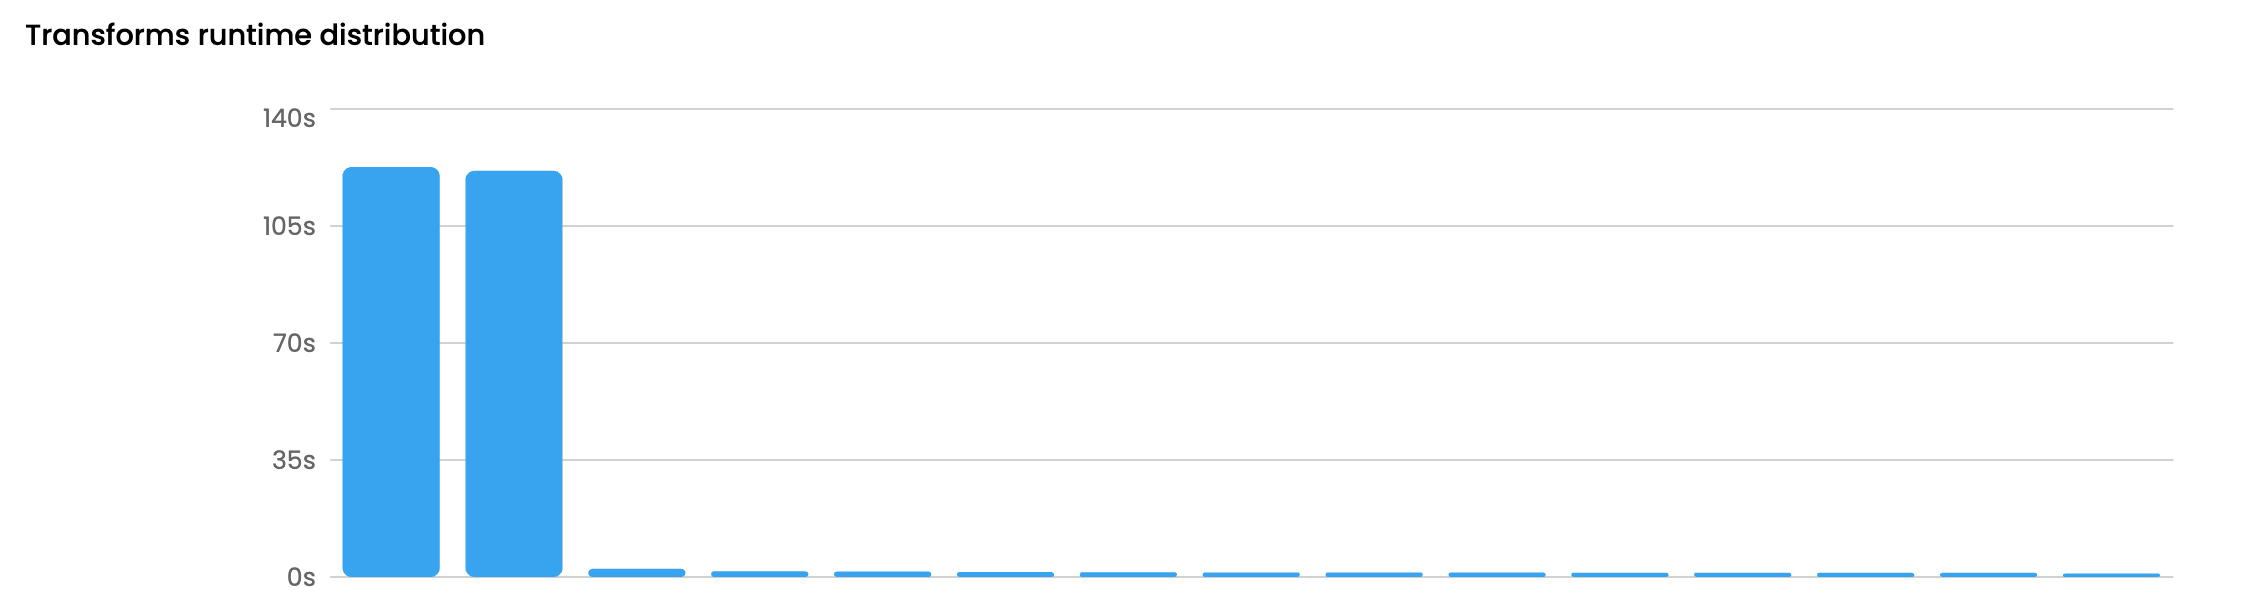
The dashboard displays the 10 slowest-running transformations and 10 most recent failed transforms within the selected time period. For each transform the run time, transform name, group name, start time and end time are visible.
Histogram displaying transform runtime. Hover over to view the transform name.
Updated 7 months ago