
Pipelines
The map of all your transforms working together
Introduction
The pipelines page is a DAG or directed acyclic graph that helps you understand the ecosystem of your data sources, extracts, and transforms, and their dependencies in a single view. Think of it as a map of how data flows through the system.
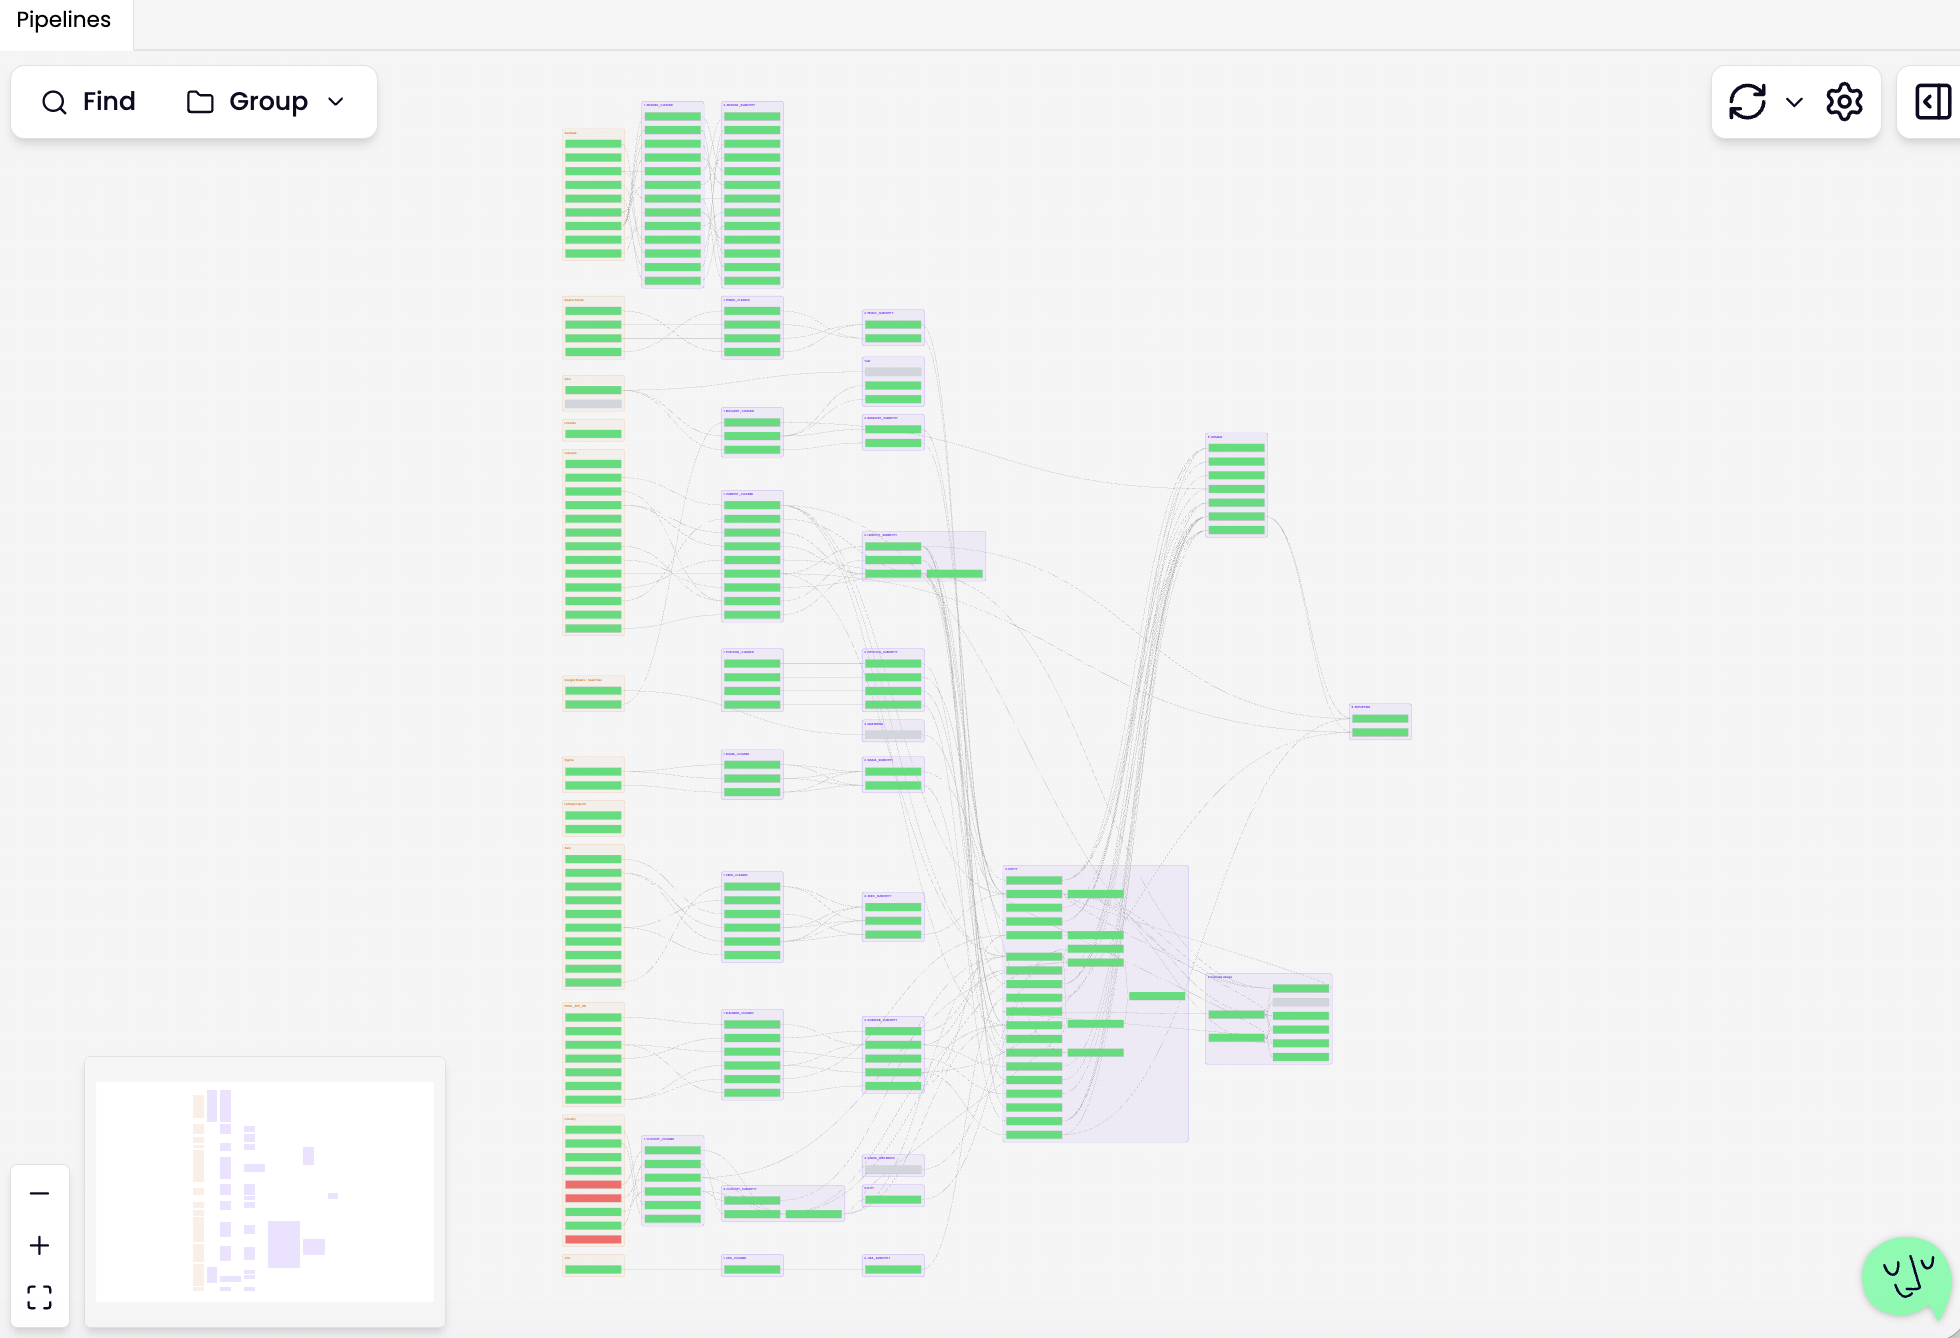
Canvas Actions
- To move around the canvas, click and hold the left mouse button
- To zoom in and out, use the scroll wheel on your mouse, pinch zoom on a laptop, or click the zoom buttons in the bottom left corner
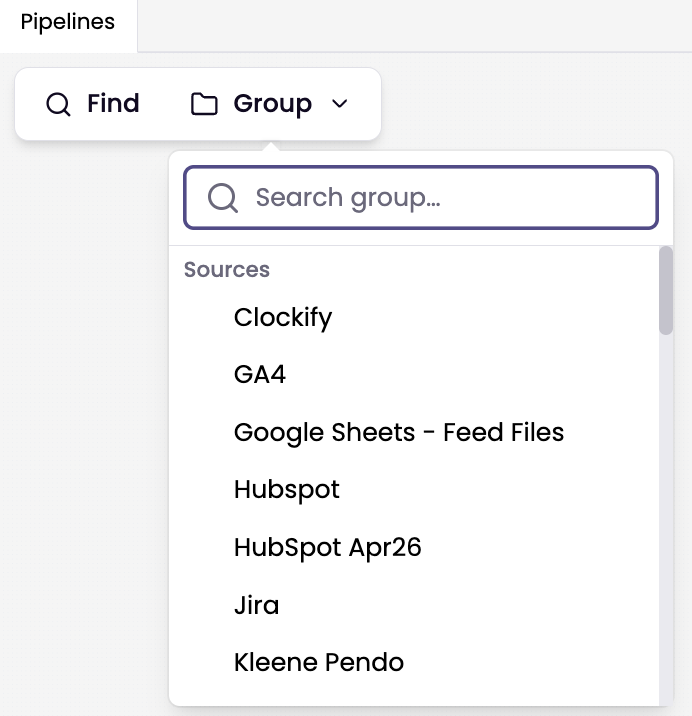
- To filter and find specific sources, transforms, or data models, click in the Group menu. To go directly to the node search using Find
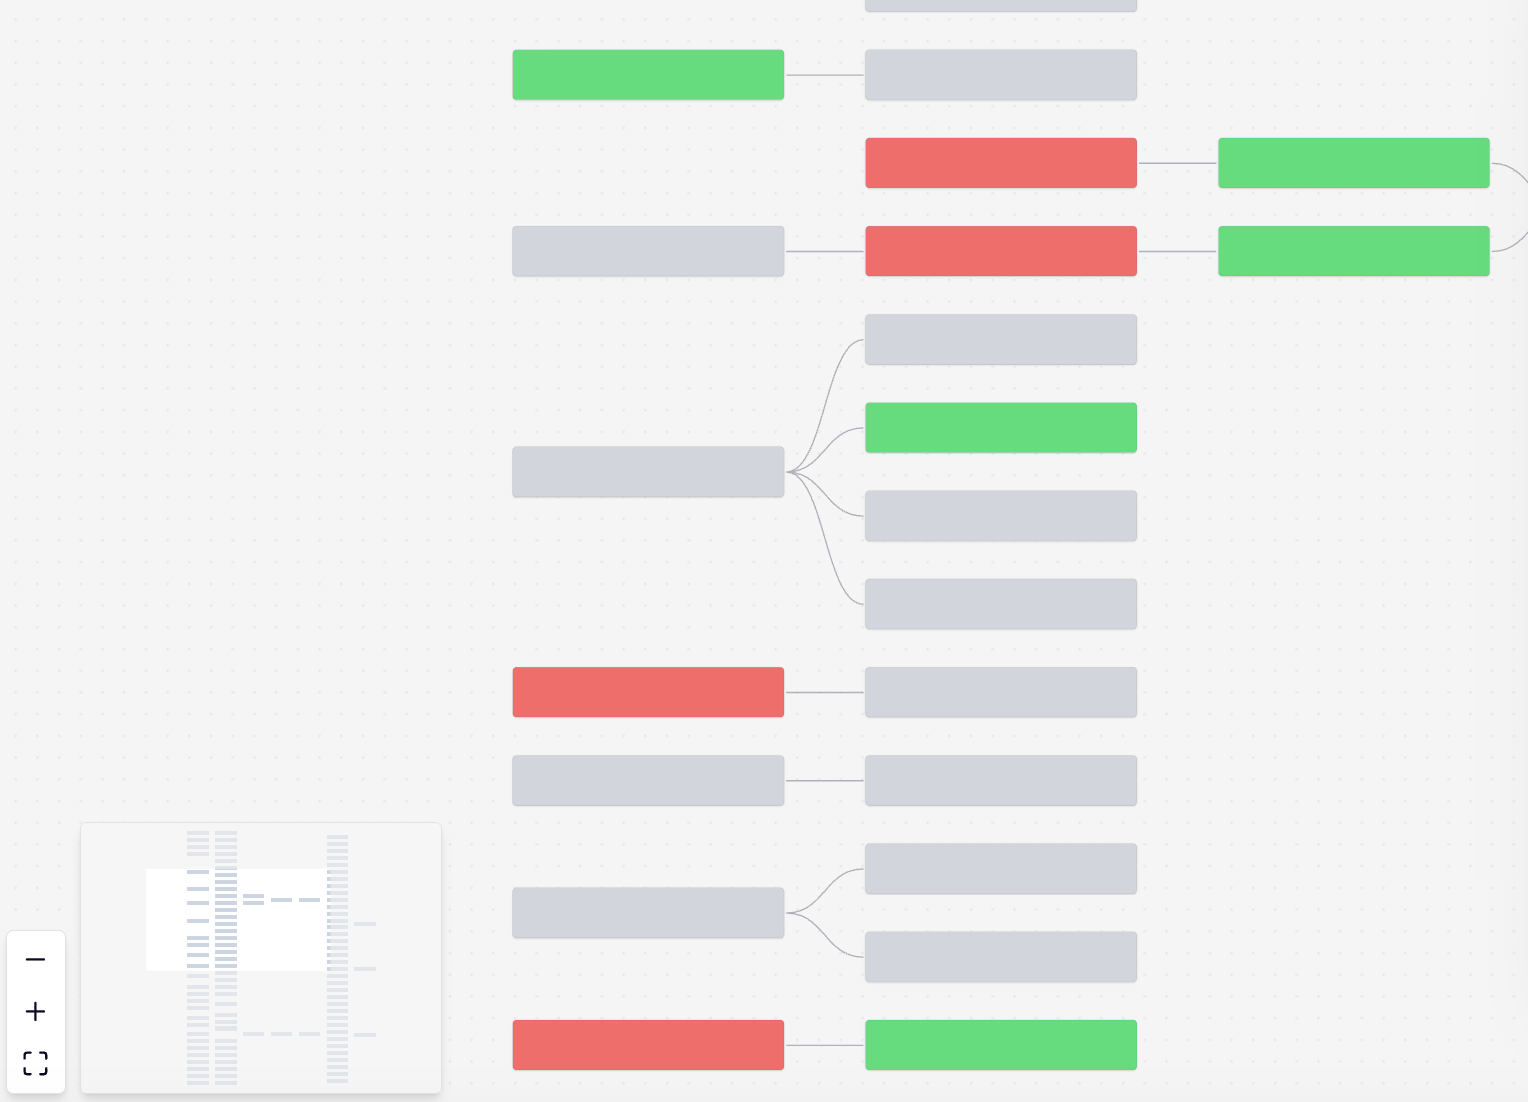
- To use the mini map, click the map icon at the bottom left and drag the bounding box to quickly navigate the entire pipeline
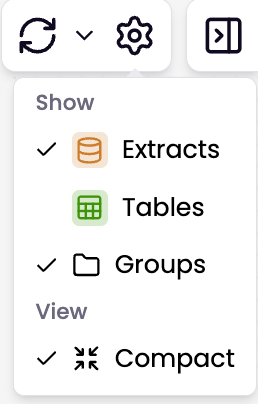
- Click the settings cog to show or hide extracts, tables, and groups on the pipeline. You can also switch between the Compact pipeline views.
Nodes
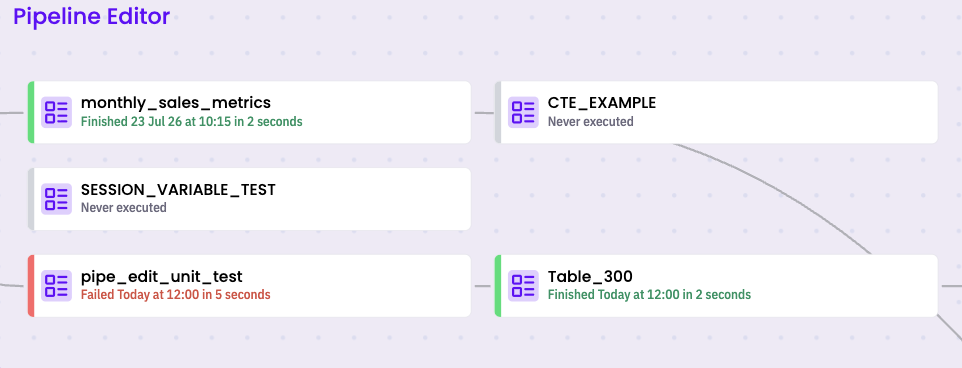
Each Transform node displays its status through color coding and shows when it was last run. Even when zoomed out, failed Transforms are immediately visible due to their red coloring.
You can perform various actions on each node by left or right clicking.
Right click node actions
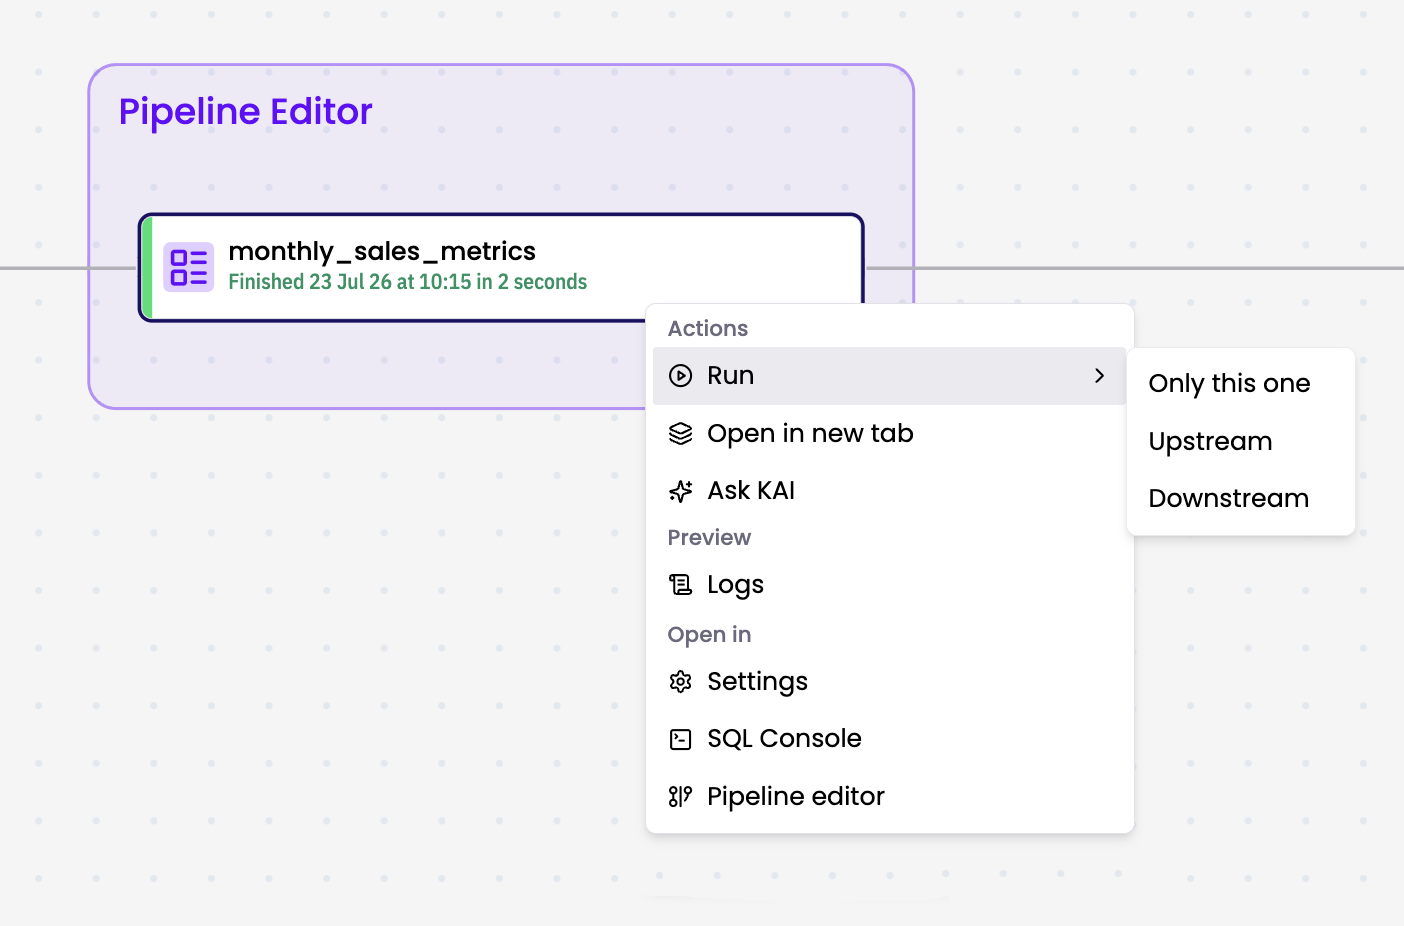
Transform actions:
- Click Run to open a menu where you can select Run only this one, Run upstream, or Run downstream.
- Click Open in new tab to open the node in a new tab.
- Click Ask AI to use KAI.
- Click Logs to open the Logs page, pre-filtered for this transform.
- Click Execution timeline to review transform runs.
- Click Settings to edit the transform name, schedules, and other properties.
- Click SQL Console to open the SQL Console for that transform.
- Click Pipeline Editor to open the transform in the Pipeline Editor.
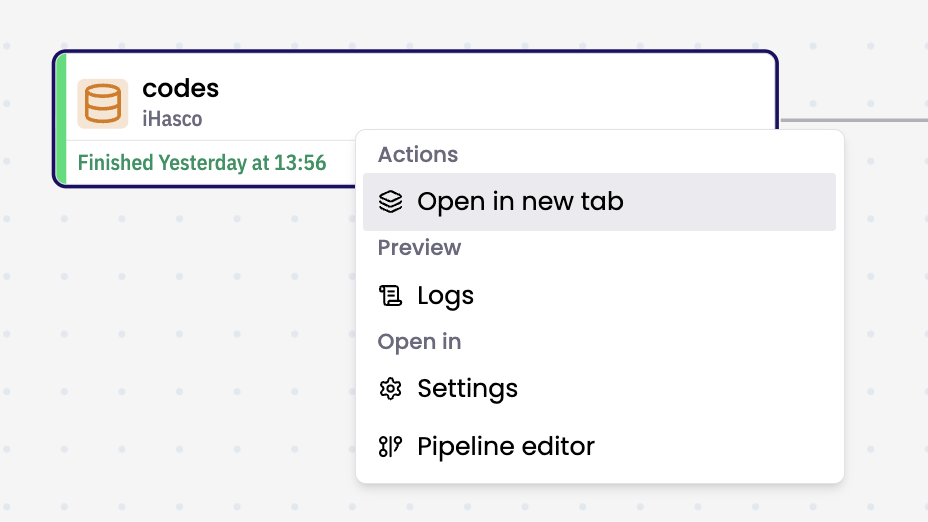
Extract actions:
- Click Open in new tab to open the node in a new tab.
- Click Logs to open the Logs page, pre-filtered for this extract.
- Click Settings to edit the extract name, schedules, and other properties.
- Click Pipeline Editor to open the extract in the Pipeline Editor.
Pipeline Execution Summary
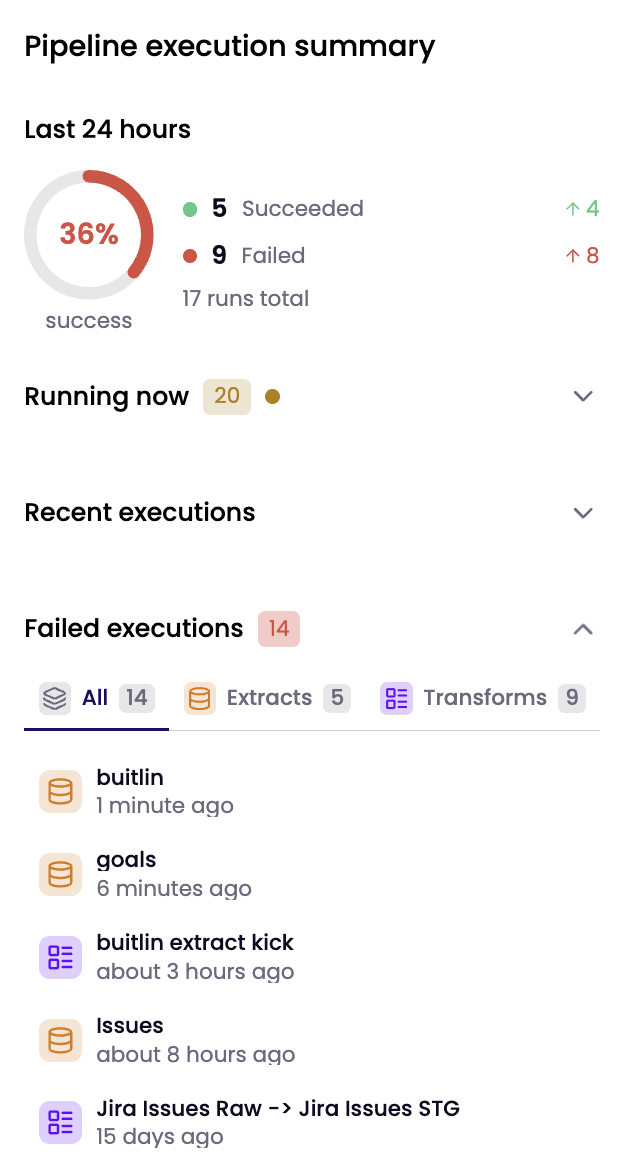
The Pipeline execution summary is the live monitoring companion to the dependency graph. This panel covers the entire workspace and is organised into four sections:
- Last 24 hours — a rolling success rate ring showing succeeded and failed counts.
- Running now — all currently in-flight executions, live-refreshing.
- Recent executions — a capped list of the most recently finished runs, whether successful or failed.
- Failed executions — a complete filterable list organised by All / Extracts / Transforms.
Use Cases
1. Canvas navigation and filters
Goal: Check that users can navigate and filter the pipeline.
Steps:
- Open Pipelines.
- Pan and zoom the canvas.
- Use the mini map to move around.
- Filter nodes using the Group menu.
- Use settings to show or hide extracts, tables, and groups.
- Switch between Default and Classic views.
Expected: Navigation is smooth, filters work and clear correctly, and view changes show accurate data without errors.
2. Node status and actions
Goal: Check node status colours and available actions.
Steps:
- Confirm failed transforms remain visible at different zoom levels.
- Right-click a transform and test Run, Open in new tab, Ask AI, Logs, Settings, SQL Console, and Pipeline Editor.
- Confirm Logs opens filtered to the selected transform.
- Right-click an extract and test Open in new tab, Logs, Settings, and Pipeline Editor.
Expected: Status colours are accurate, each node shows the correct actions, and links open the right destination without errors.
3. Pipeline Execution Summary
Goal: Check that the workspace execution summary is accurate and updates live.
Steps:
- Confirm Last 24 hours shows the correct success rate and succeeded and failed counts.
- Start a run and confirm it appears in Running now without refreshing.
- When the run completes, confirm it moves to Recent executions with the correct status.
- Trigger a failure and confirm it appears in Failed executions.
- Test the All, Extracts, and Transforms filters.
- Refresh the page and confirm the summary remains accurate.
Expected: Counts match completed runs, live executions update automatically, recent and failed runs appear correctly, and filters return accurate results without duplicates or stale data.
Updated 13 days ago