
Pipeline Editor
Gain a comprehensive understanding of a data pipeline
Introduction
The Pipeline Editor gives Kleene users a clear, end-to-end view of their data pipelines. From high-level lineage to the detailed configuration of any table or transform, it makes it easy to understand how data flows and where it’s shaped. You can edit existing transforms directly in the Pipeline Editor within a safe, virtual workspace called a sandbox. Changes made in the sandbox stay isolated from your live environment until you’re ready to publish them.
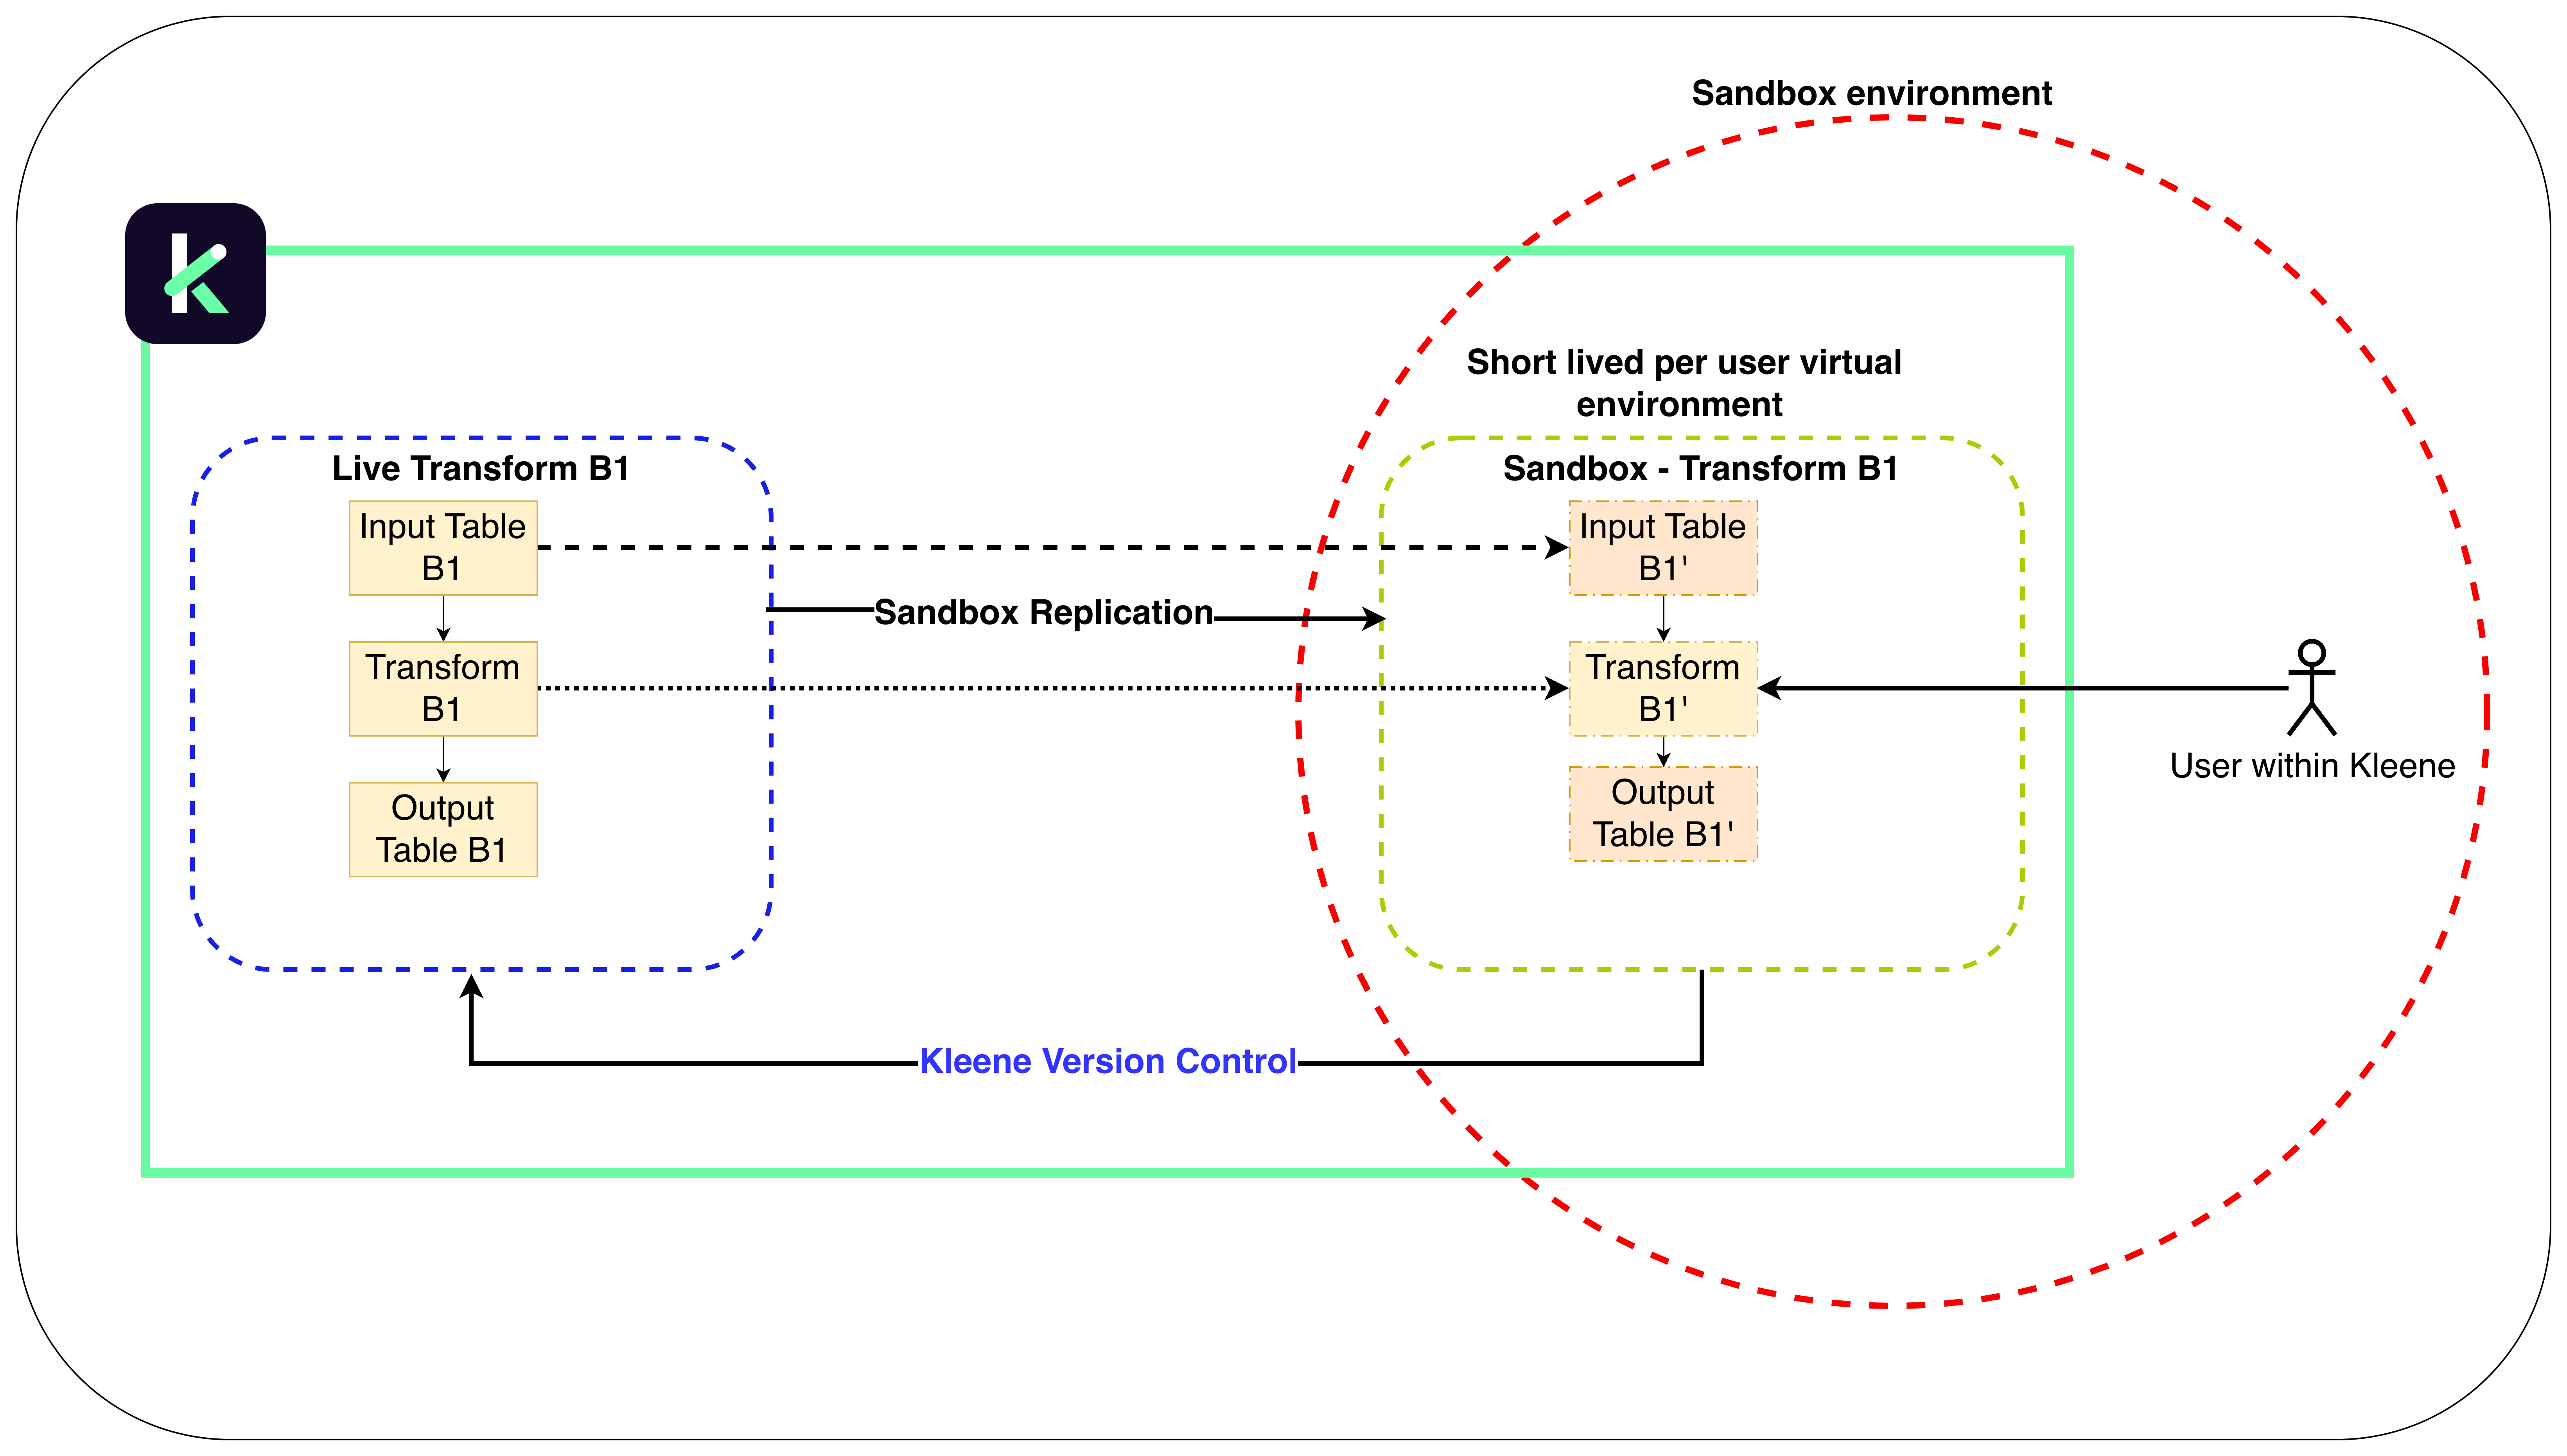
Pipeline Editor with safe sandbox environment
Accessing the Pipeline Editor
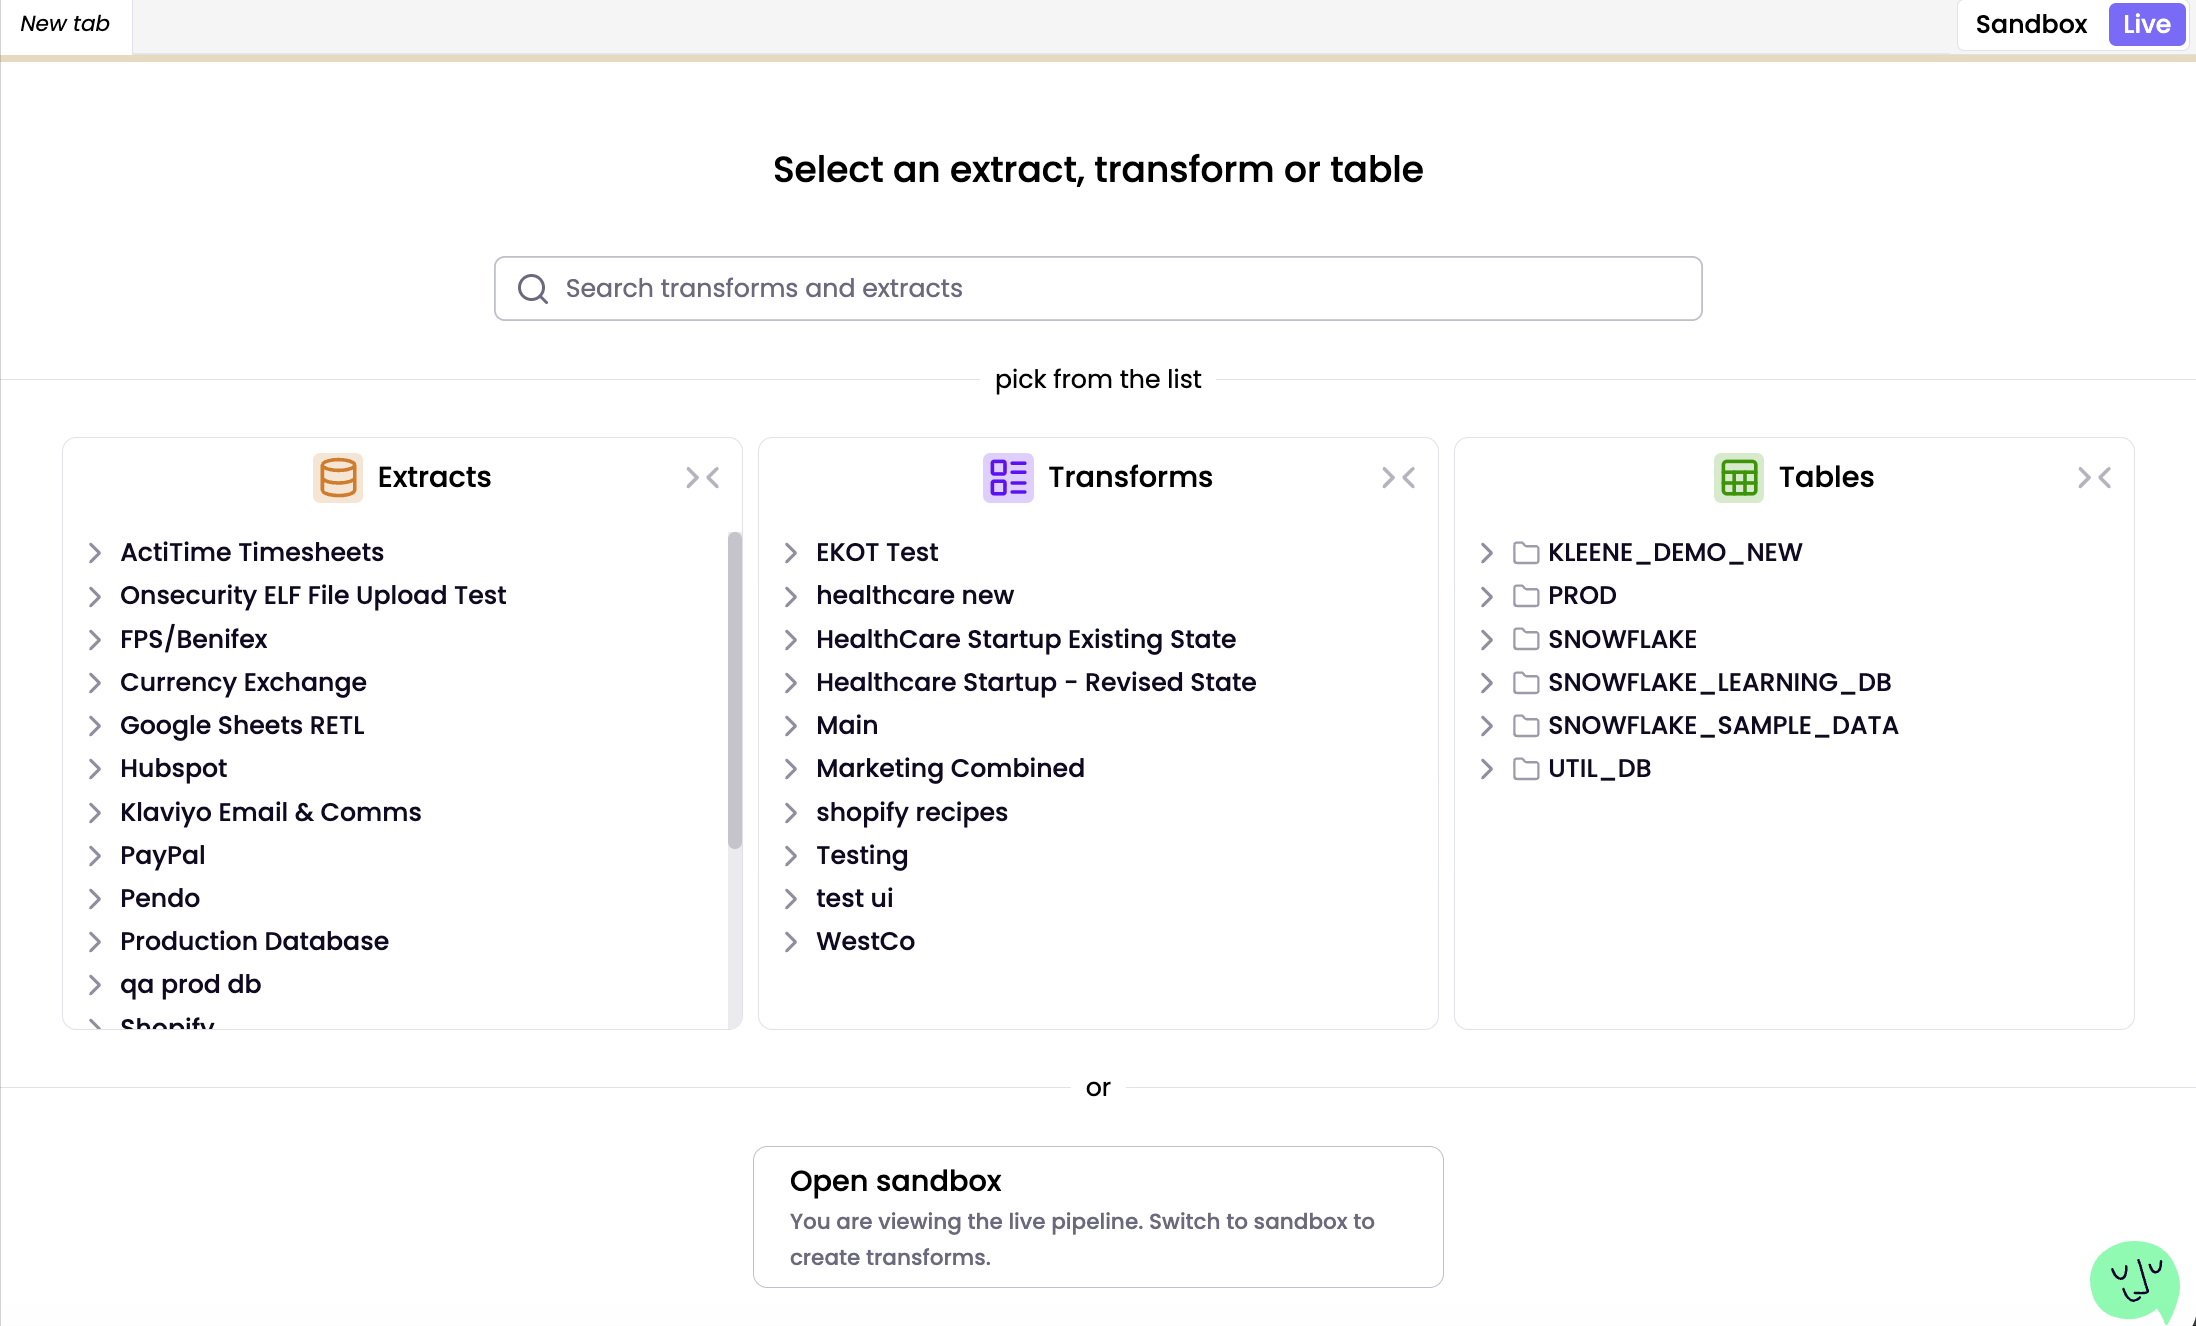
When you launch the Pipeline Editor, you land directly on the Live environment by default. This ensures you are viewing the active production state of your data. Use the toggle at the top of the editor to switch between the Sandbox and Live environment.
In the Live environment, search for transforms and extracts using the input field or browse for transforms, tables and extracts in your transform folder, schema or sources.
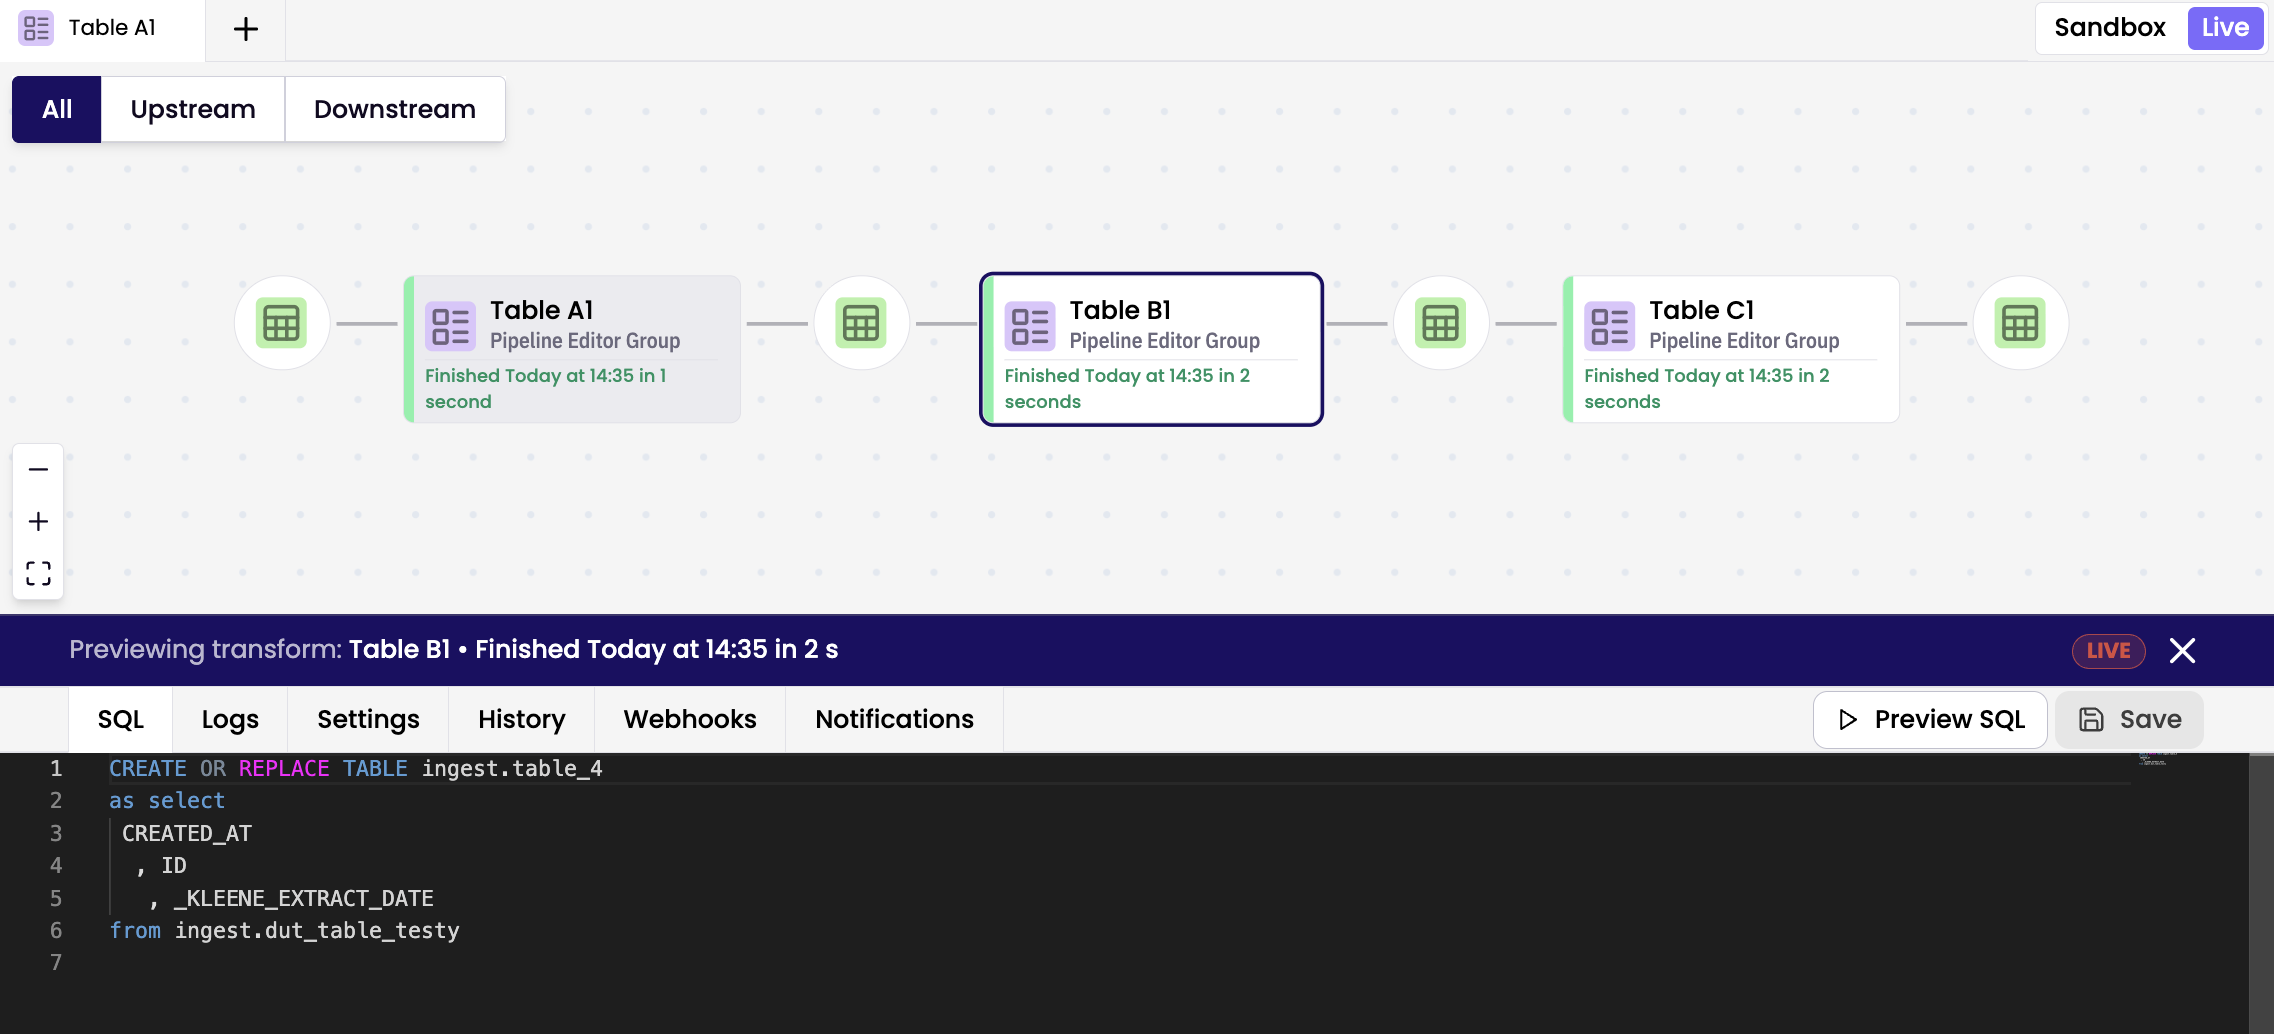
The Live environment is a read-only workspace for monitoring and execution. To run a transform via the transform node, right-click the node and select Run. Users can preview but not edit SQL, while maintaining full access to Logs, Settings, History, Webhooks, and Notifications.
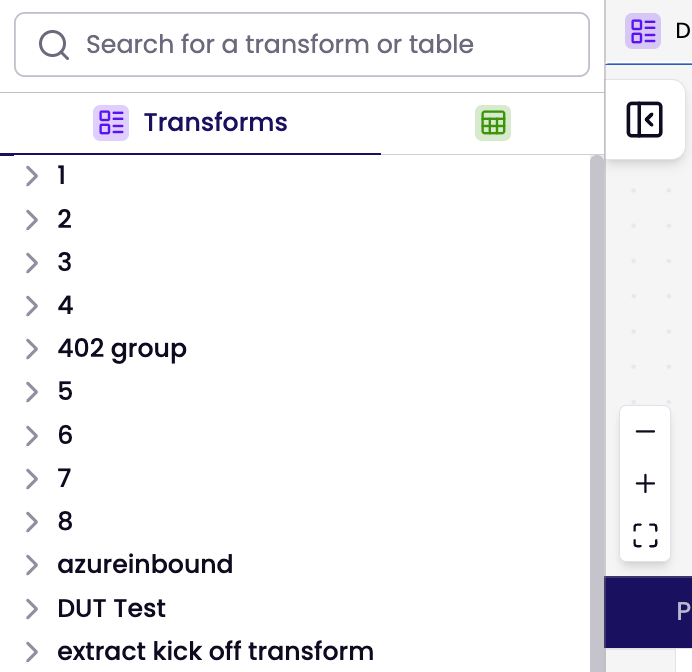
For quick to access the database and transform groups, click the expandable button on the left side of the Pipeline editor. This feature is available in both live and sandbox modes.
Sandbox
In the Sandbox environment your edits are isolated and won’t impact your live setup until you decide to publish them. When using the Pipeline Editor with Sandbox for the first time, it may take a moment to initialise. You may encounter temporary error messages, but the environment will stabilise once fully loaded.
You can open a transform, table or extract in two ways:
* Search for a specific transform or table by name using the search bar.
* Browse through transform groups or schema and click a specific transform or table to open its pipeline view.

To create a new transform:
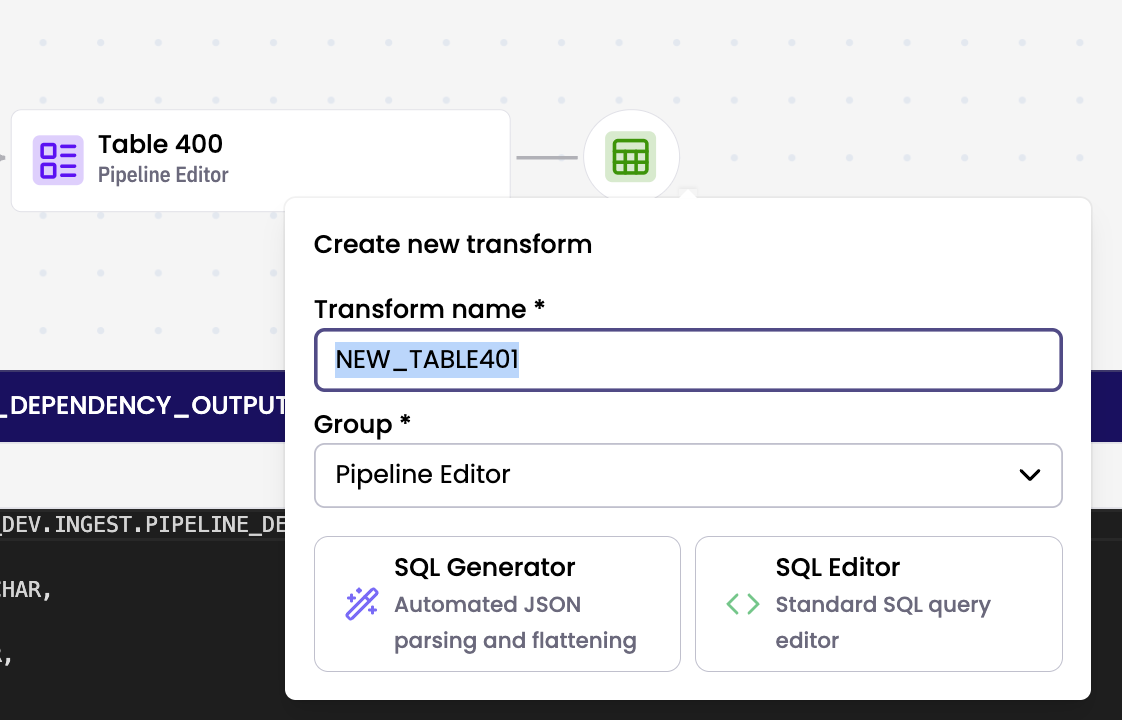
- Click Create new transform button.
- In the pop up, enter a transform name, select a group, select either SQL Generator or SQL Editor and follow through to create new transform.
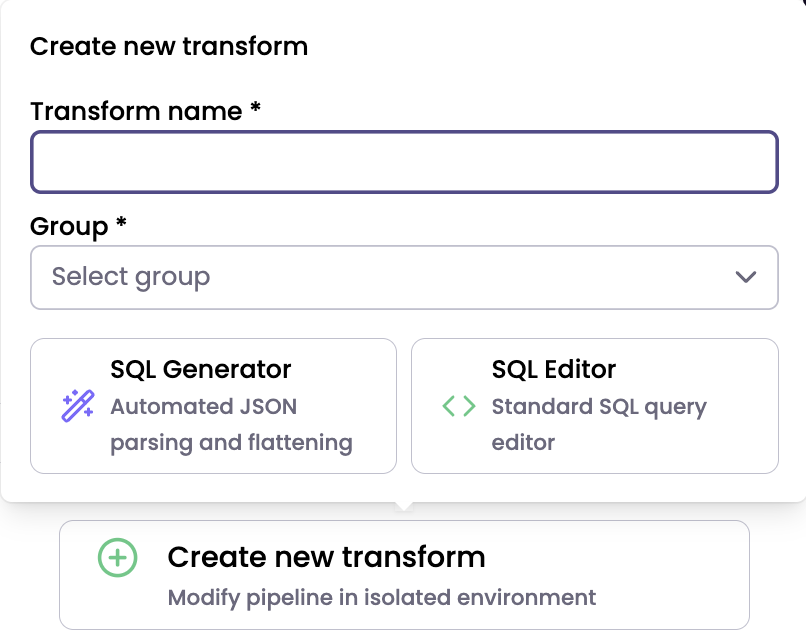
When creating a new transform, always edit and save the SQL before clicking Preview SQL.
Sandbox Summary Sidebar
Use the Sandbox Summary Sidebar to manage your development environment in the Pipeline Editor. The sidebar is located on the right side of the Pipeline Editor. Expand it to review sandbox details, or collapse it to maximise your DAG view.
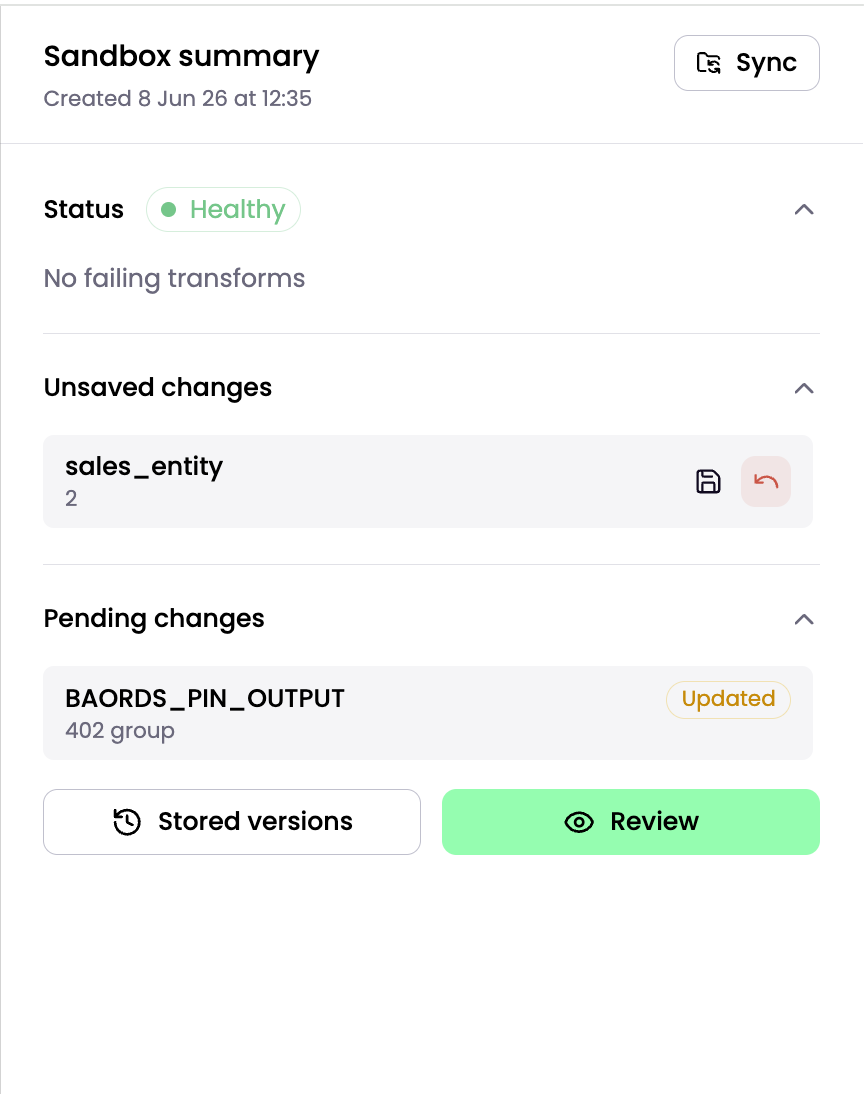
Sandbox status and metadata
The Status section shows essential information about your sandbox:
- Creation Date: Shows when the sandbox was initialised.
- Health Indicator: Marks the sandbox as Unhealthy if any job in the sandbox fails, helping you identify issues quickly.
- Sync: Pulls the latest changes from the production pipeline into your sandbox. Sync whenever changes have been made directly to live transforms and extracts, or when another user has merged updates into live.
Managing your work
The sidebar organises your work into two lists:
- Unsaved Changes: Lists transforms you have modified but not yet saved. Click the Save icon next to an item to save your changes.
- Pending Changes: Lists saved transforms that are ready for review.
- Review: Open the summary modal to choose which pending changes to Reset, Stash, or Commit. Select the checkbox next to each pending change you want to include in the action. Only selected items are processed when you run the action, and unselected items remain pending. The Reset, Stash, and Commit buttons are disabled when no pending changes are selected.
Stored versions
Use Stored Versions to browse the history of your sandbox and reference previous pipeline configurations.
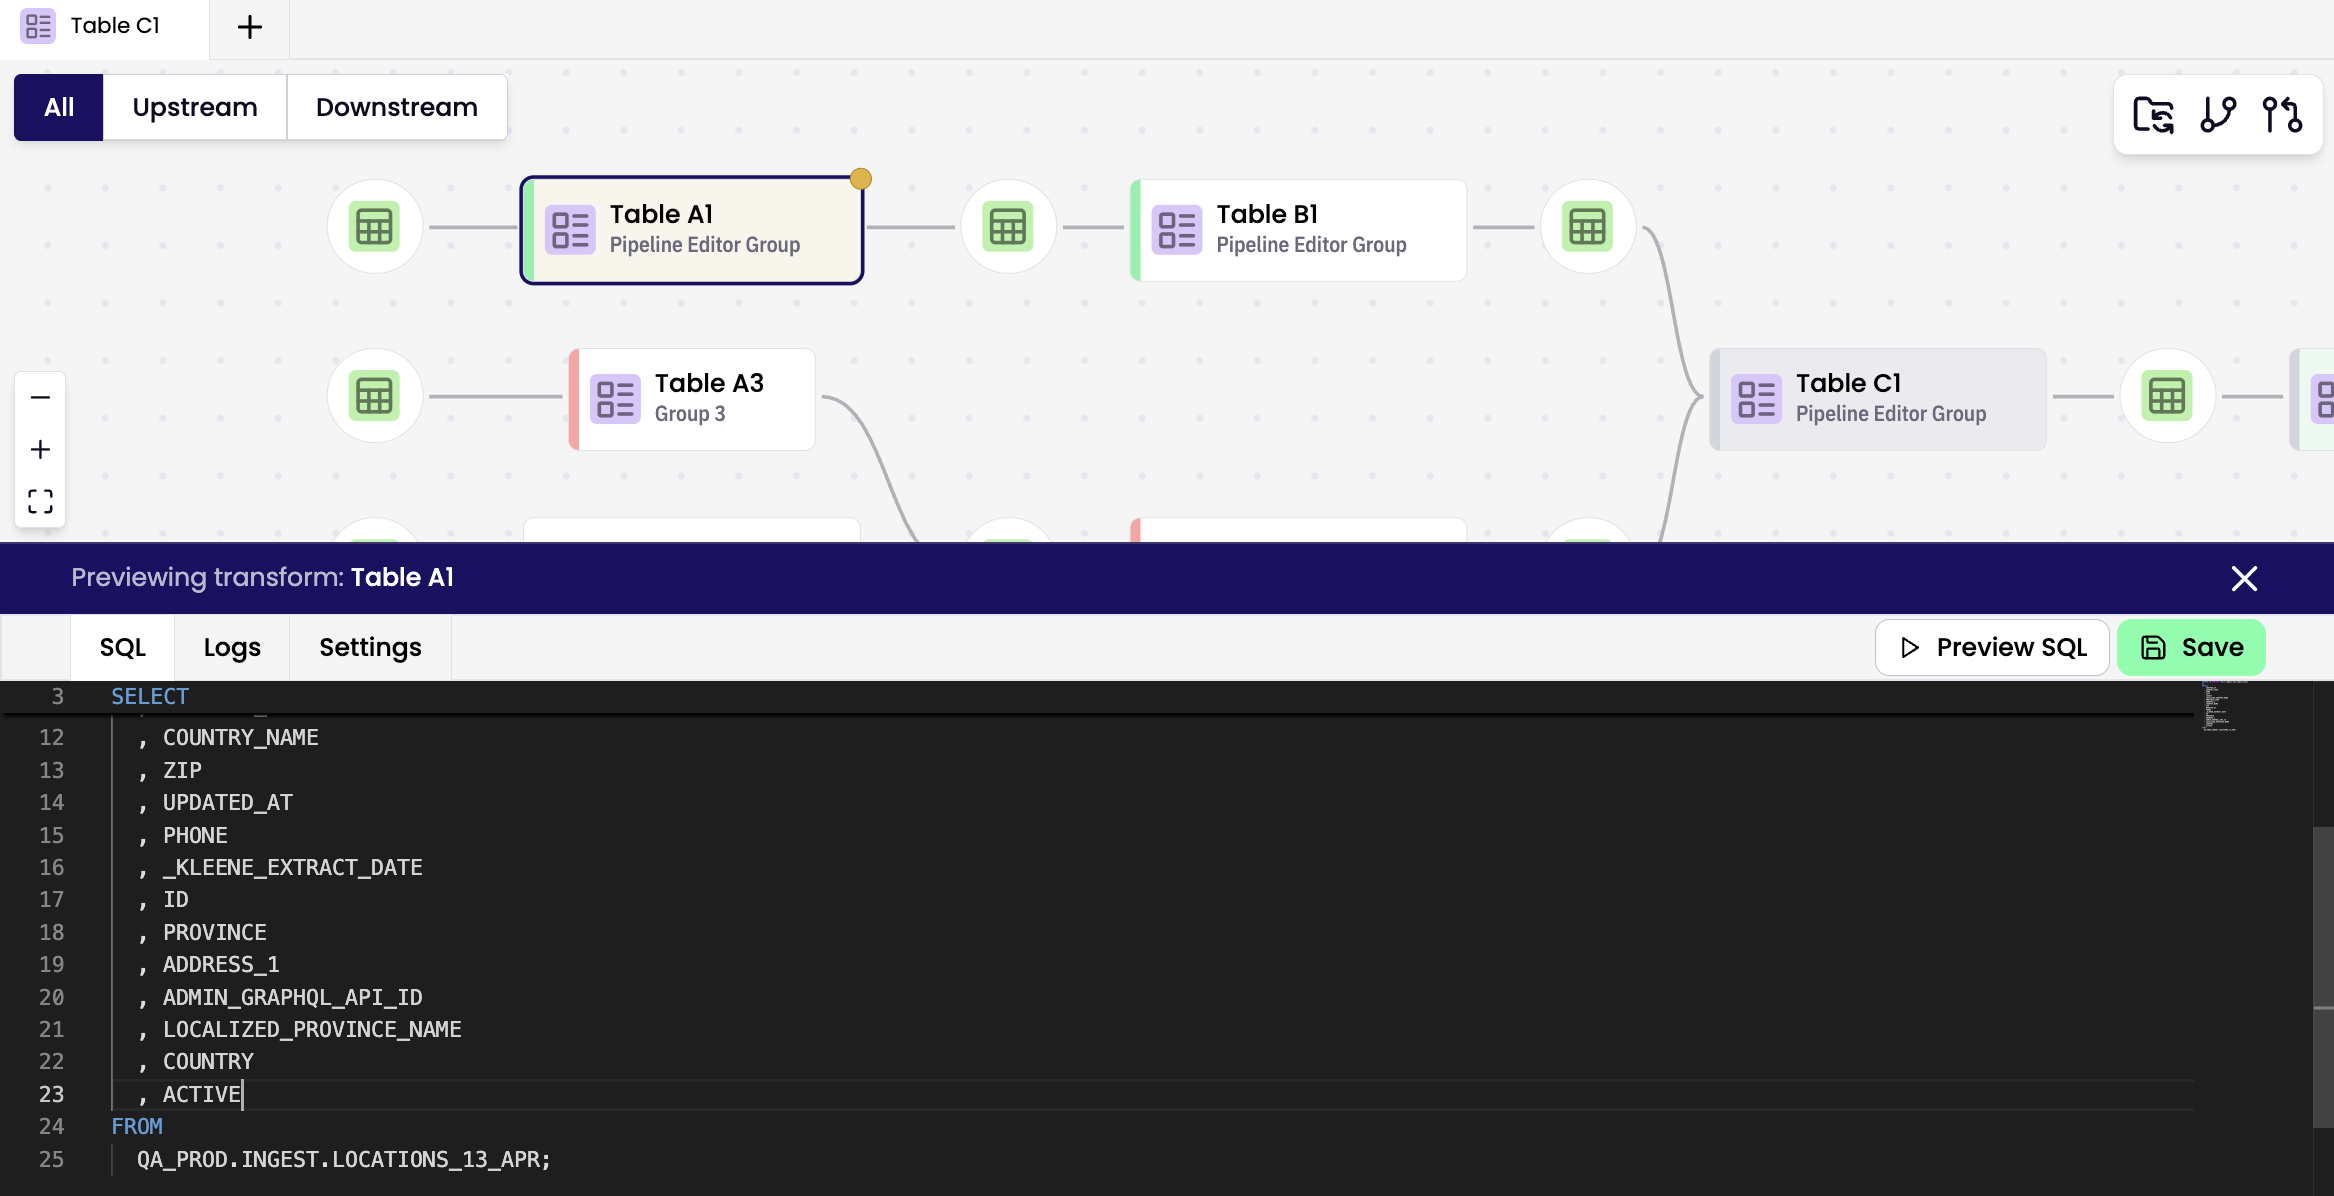
Navigating the Pipeline View
The Pipeline View provides a clear, visual representation of your data flow:
* Upstream nodes appear on the left.
* Downstream nodes appear on the right.
You can zoom, pan, and highlight dependencies for better visibility. Double-click any node to open it in the editor.
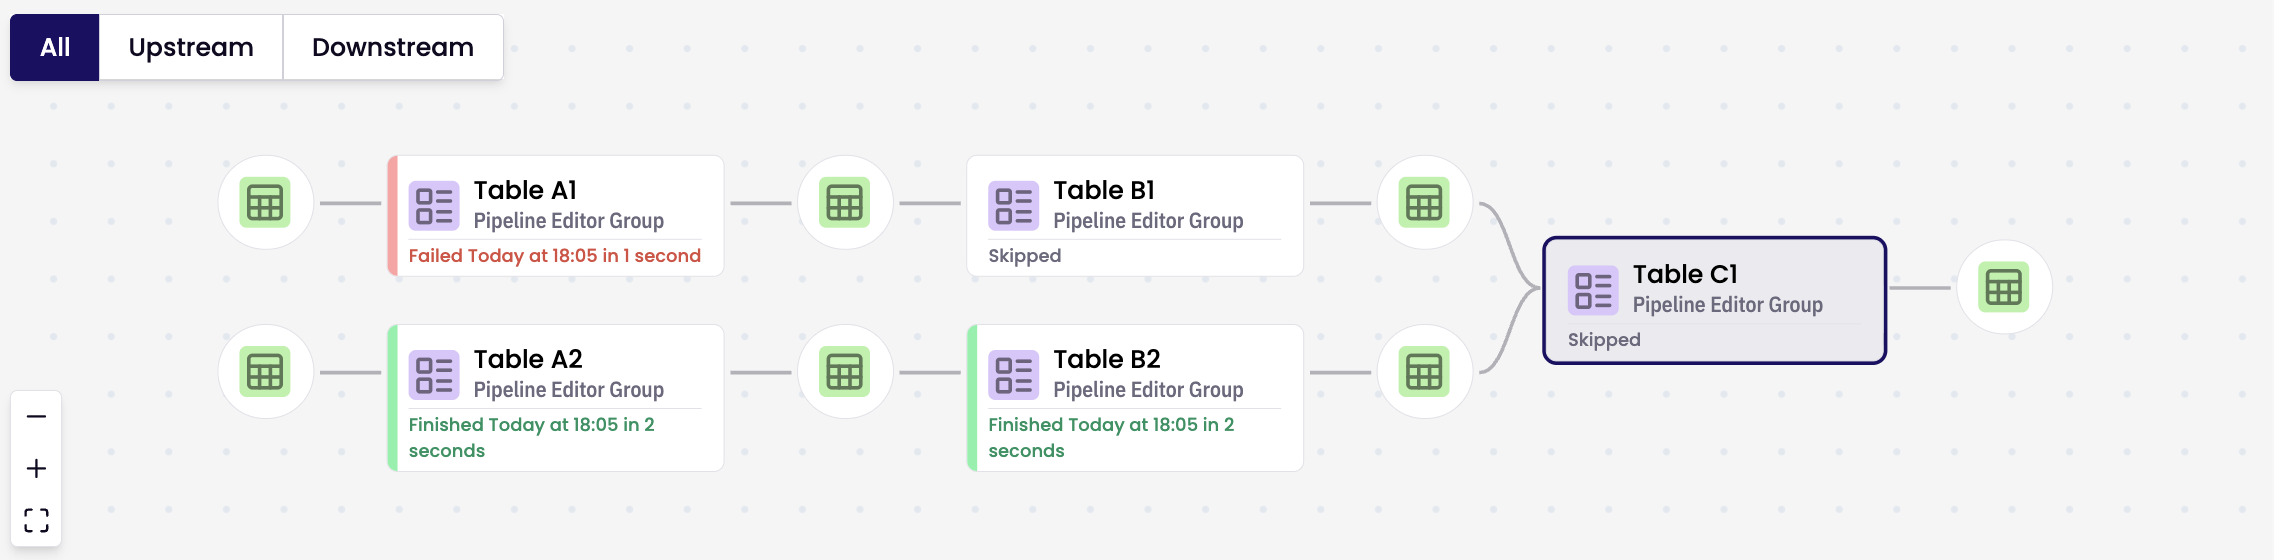
Visual indicators
There are 2 types of transform colour code; node and bar.
Node Side Bar Indicators
Red sidebar — Failed

Yellow sidebar — Updating
Grey sidebar — Blocked by upstream failure

Green sidebar — Successfully propagated transform

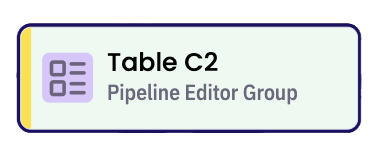
Node Body Indicators
White — Live version

Yellow — Live, but modified in the sandbox

Green — Newly created in the sandbox

Grey — Pipeline Root Transform (Starting Node)

Other
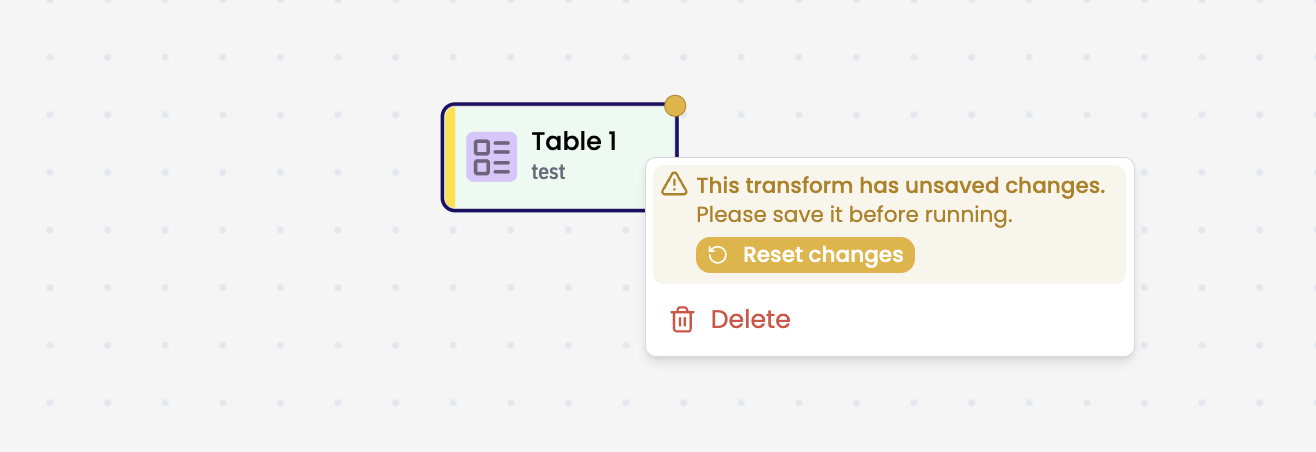
Yellow dot — Unsaved changes

Right-click the node with unsaved changes and select Reset changes to undo any unsaved edits.
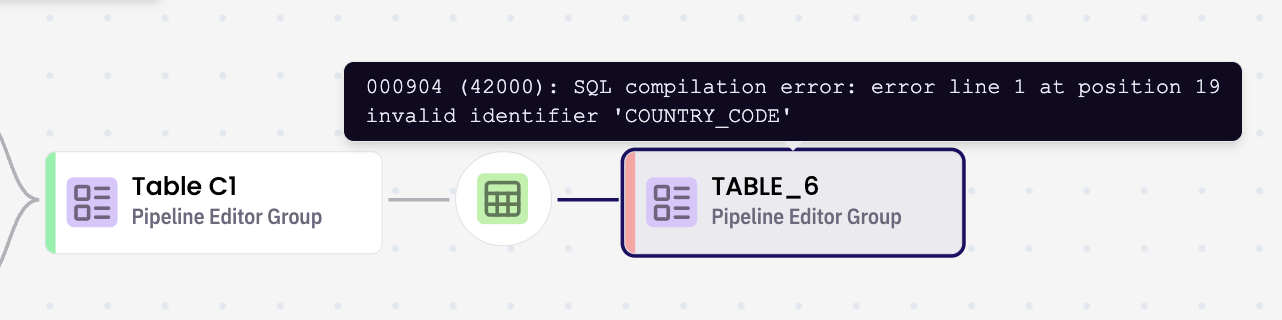
Hover over a failed transform to view the error message
Right-click a transform node to option to Delete.

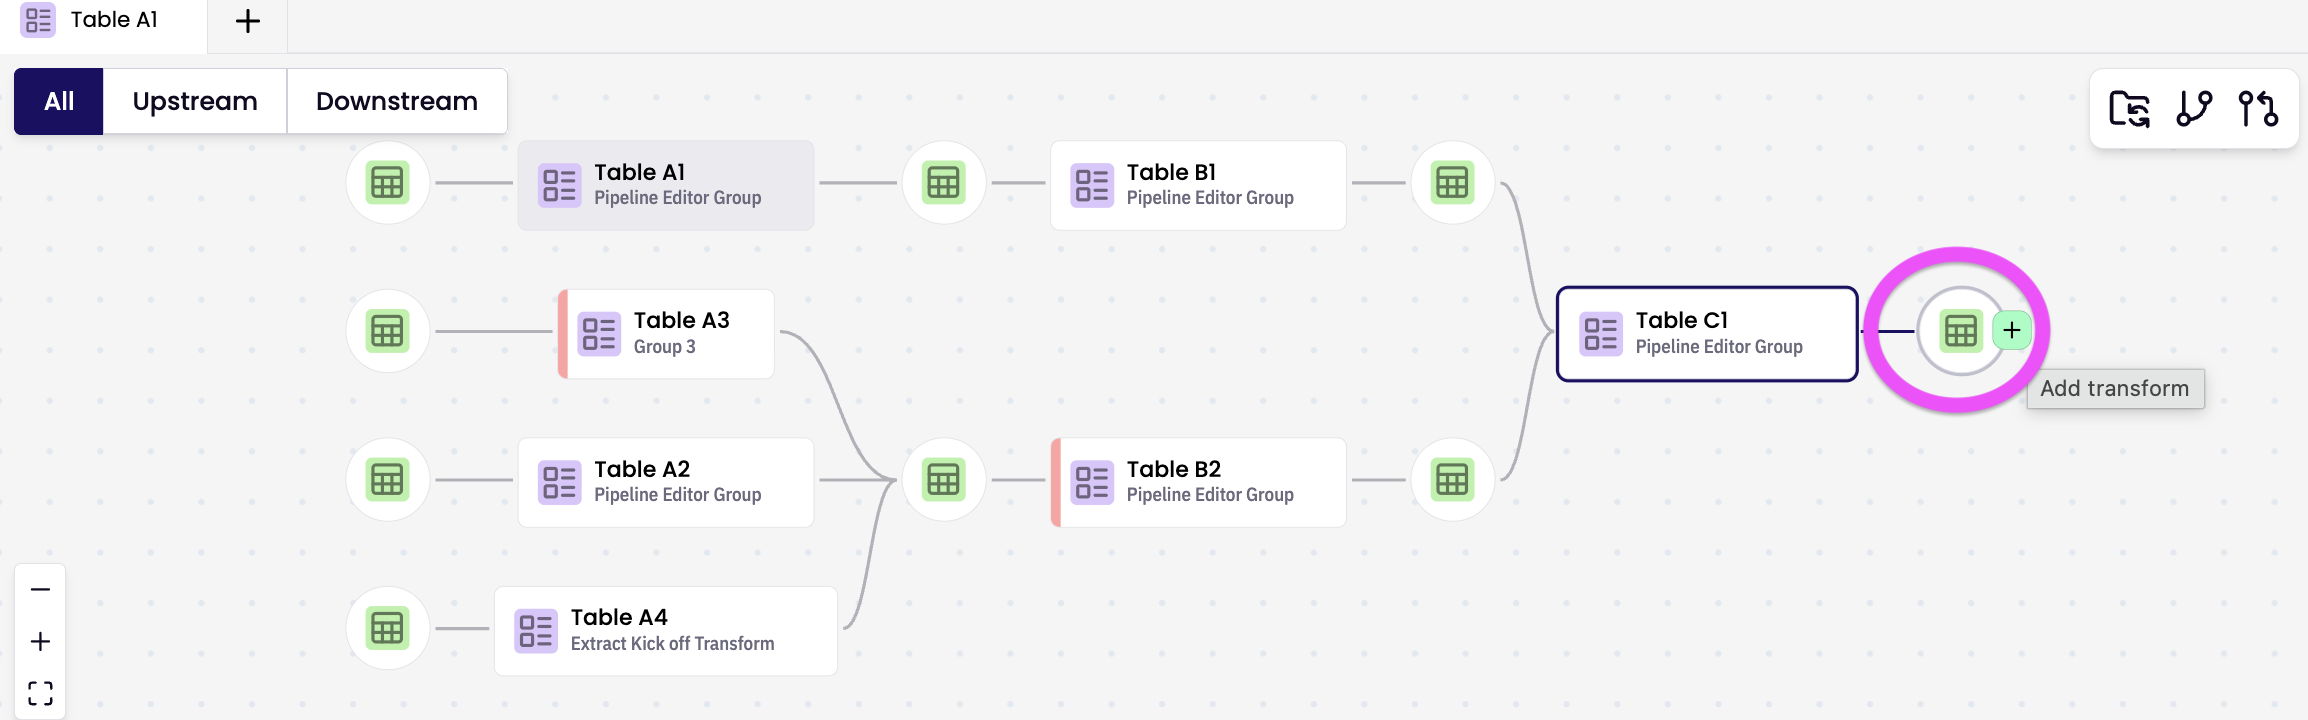
Creating a new transform via table node
To add a new transform, hover over a table node and click the '+' button to open the pre-populated Create new transform modal.
Pre-populated Create new transform modal is displayed. Edit as preferred and select either SQL Generator or SQL Editor and follow through to create new transform. A new transform is created and the table node is displayed in the relevant pipeline branch.
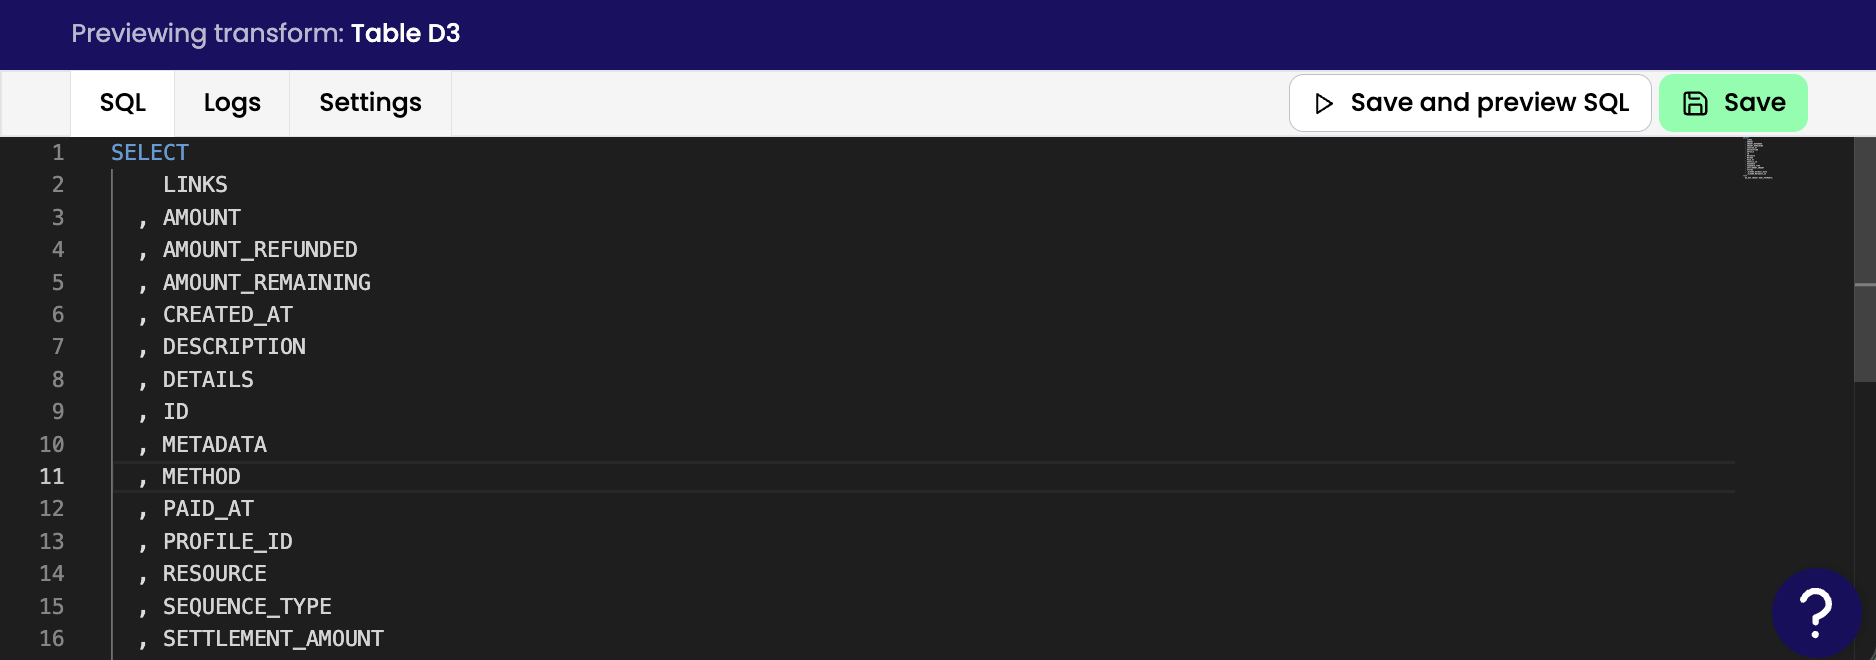
Working with Transforms
Edit SQL code directly in the editor.
On newly created or updated transforms click Save and Preview SQL to review and save your changes.
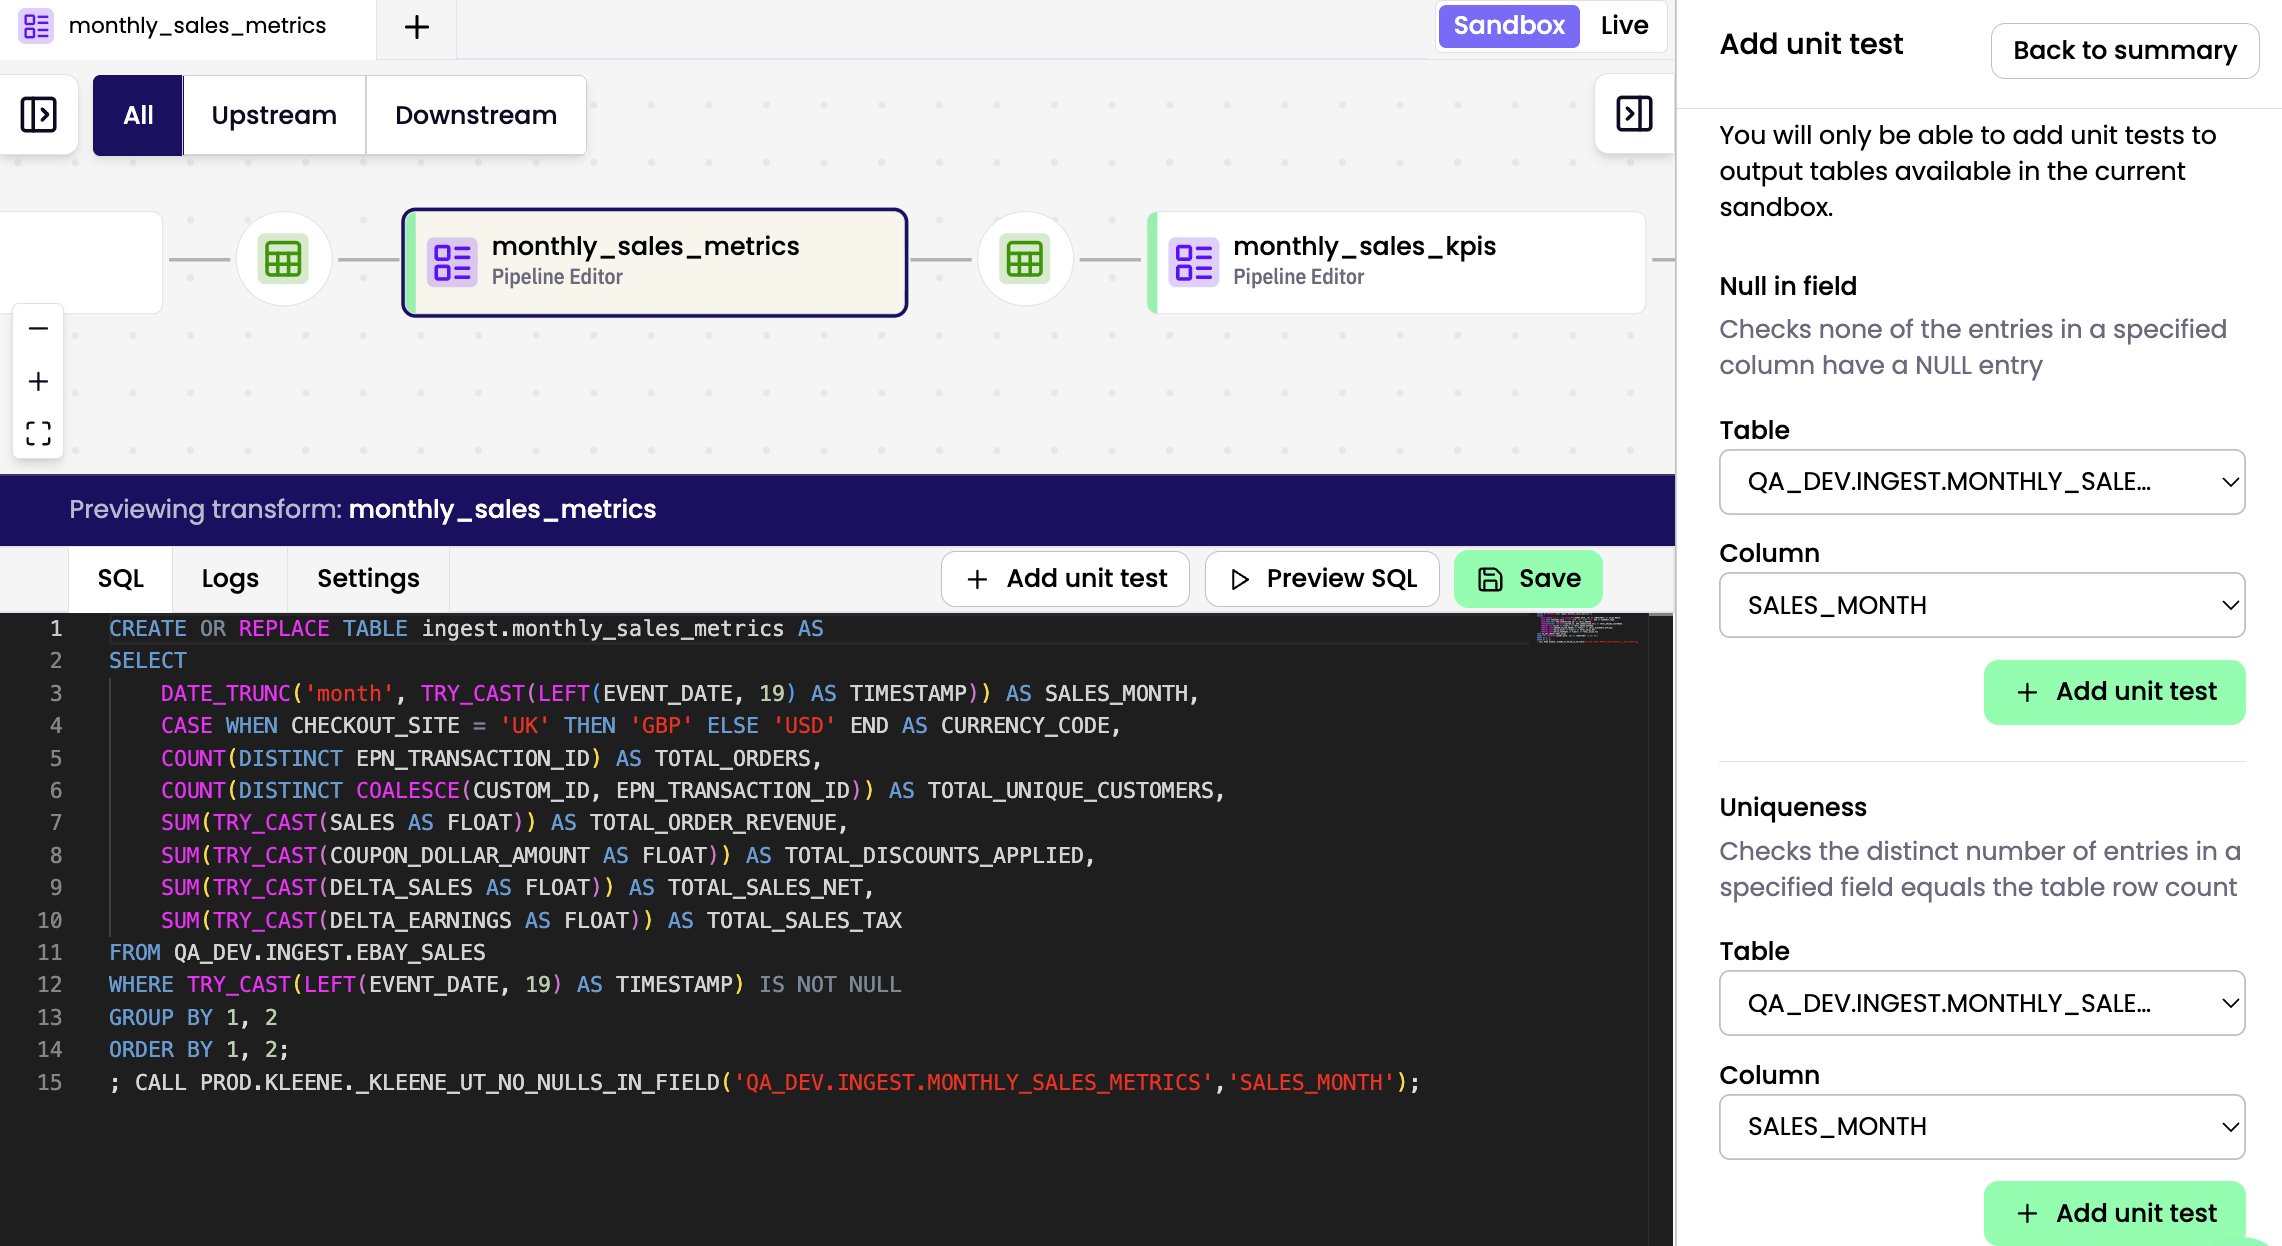
Click the Add Unit Test button to create tests for your transform. The Unit Test panel opens, allowing you to add relevant test cases. The Add Unit Test option is only available for transforms that have both input and output tables.
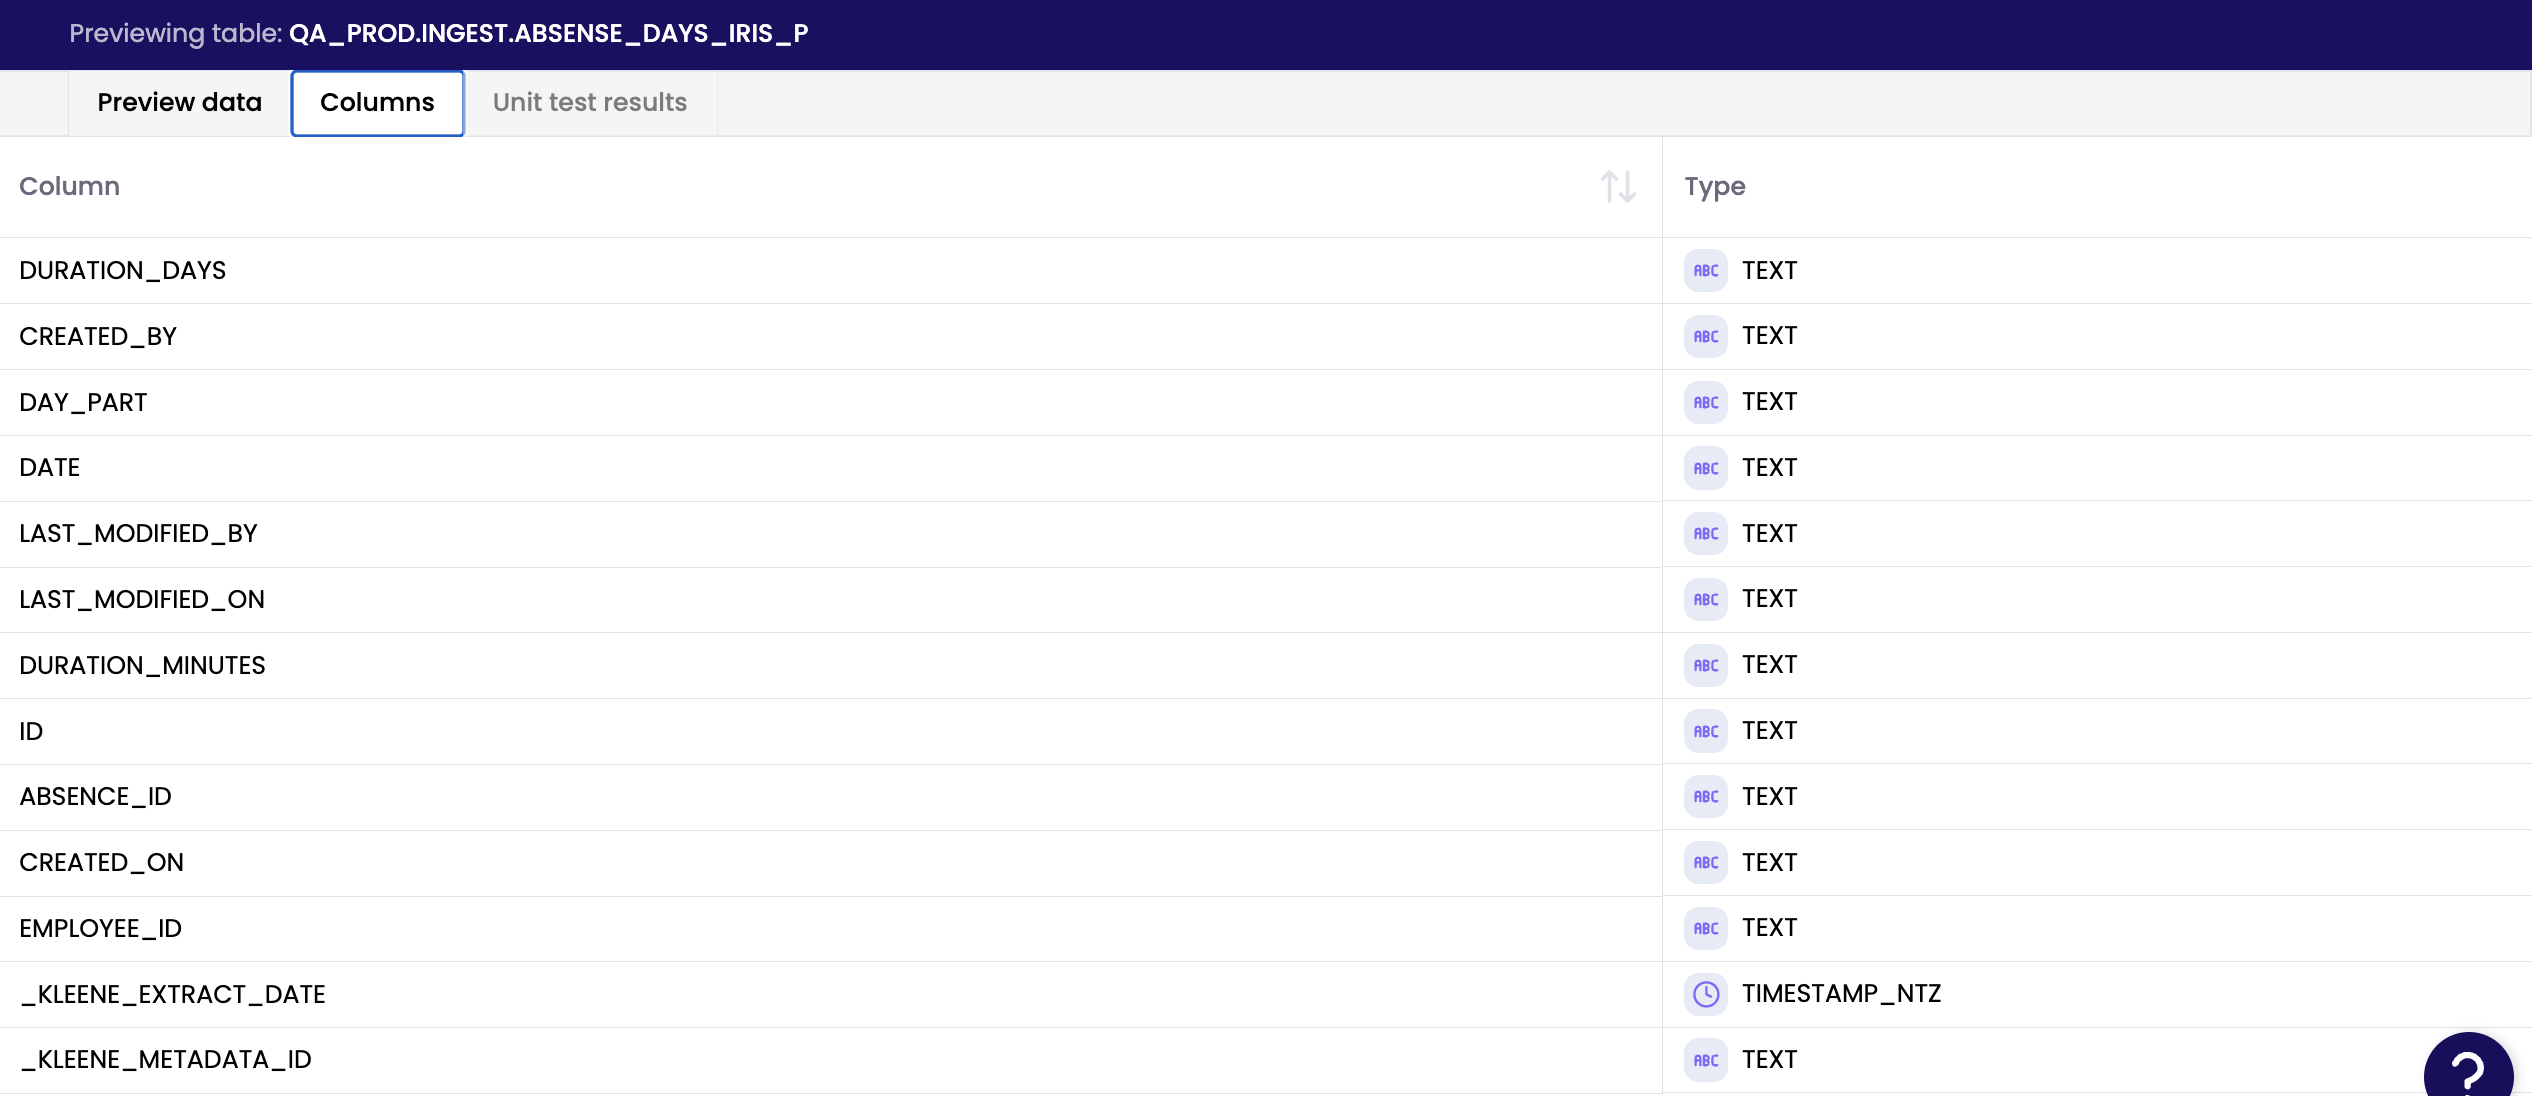
Working with Tables
Preview data to examine a sample of the table's contents.
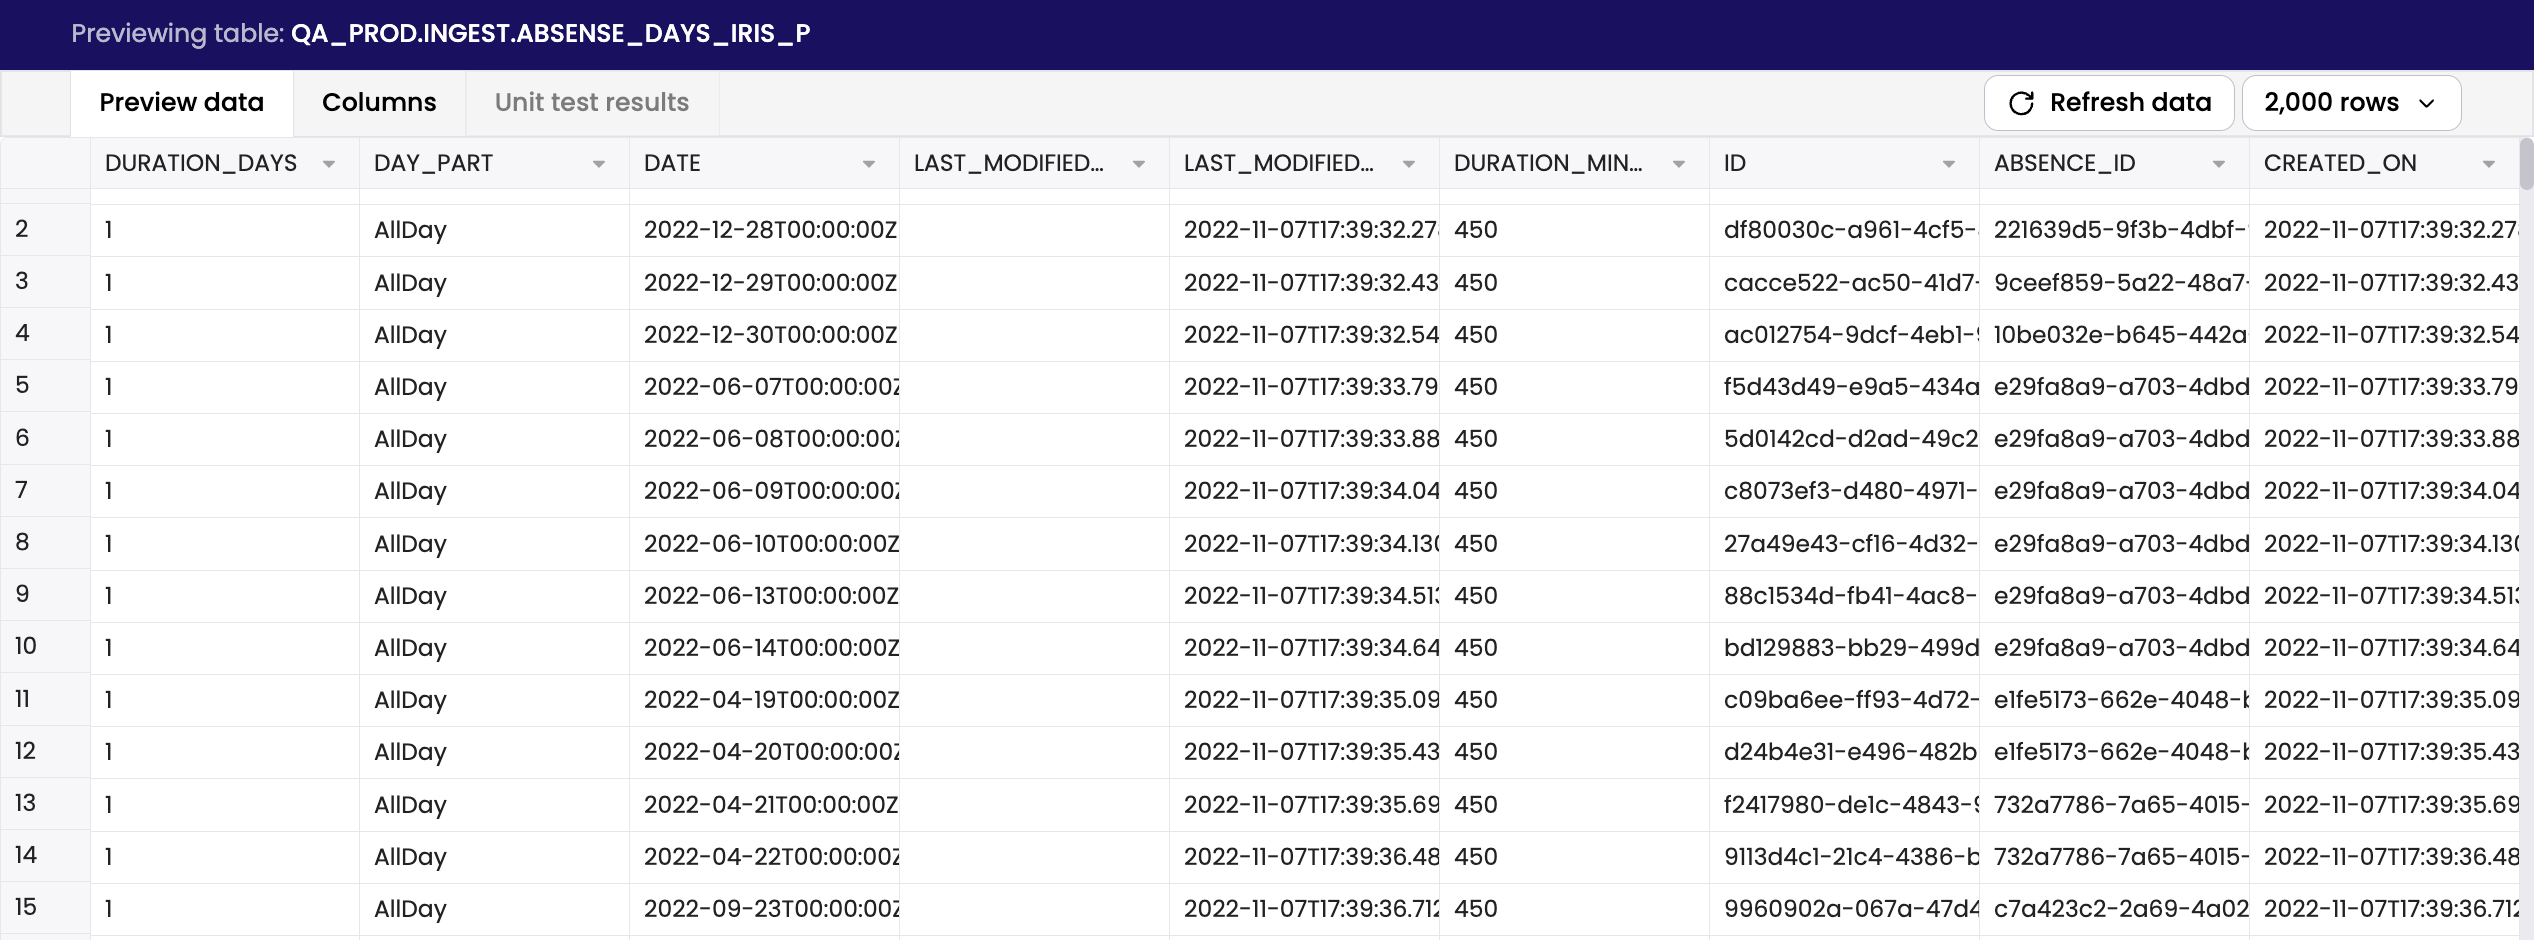
Examine column names and data type.
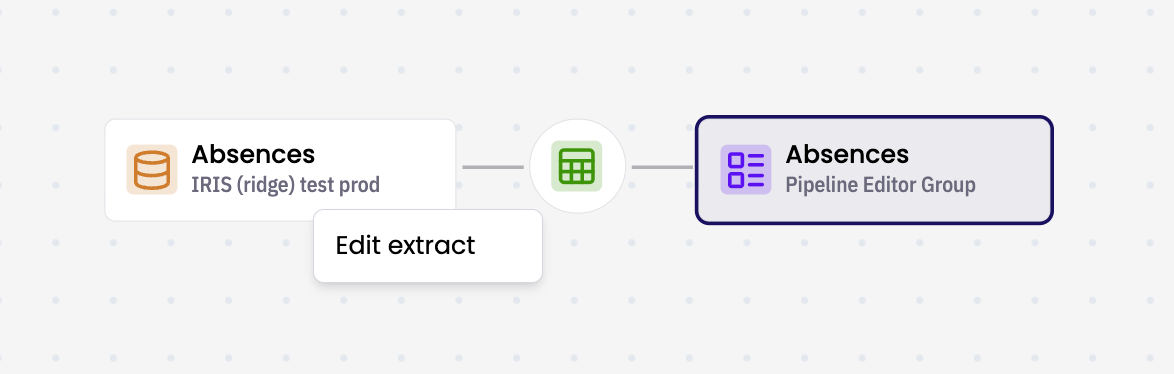
Working with Extracts
Right Click an extract node and click Edit extract to update it's configuration. Details and Logs are available in the preview panel.
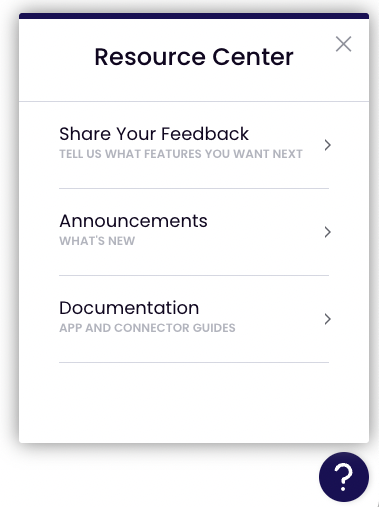
Feature Requests
To suggest a new feature go into Resource Center, Share Your Feedback and add a suggestion.
Updated 25 days ago