
Data Models
An entity relationship diagram (ERD) of every table in a schema of the warehouse
Introduction
The ERD is a visual display of every field across every table in a schema within the warehouse, it also presents the relationships between those tables and fields.
What is shown
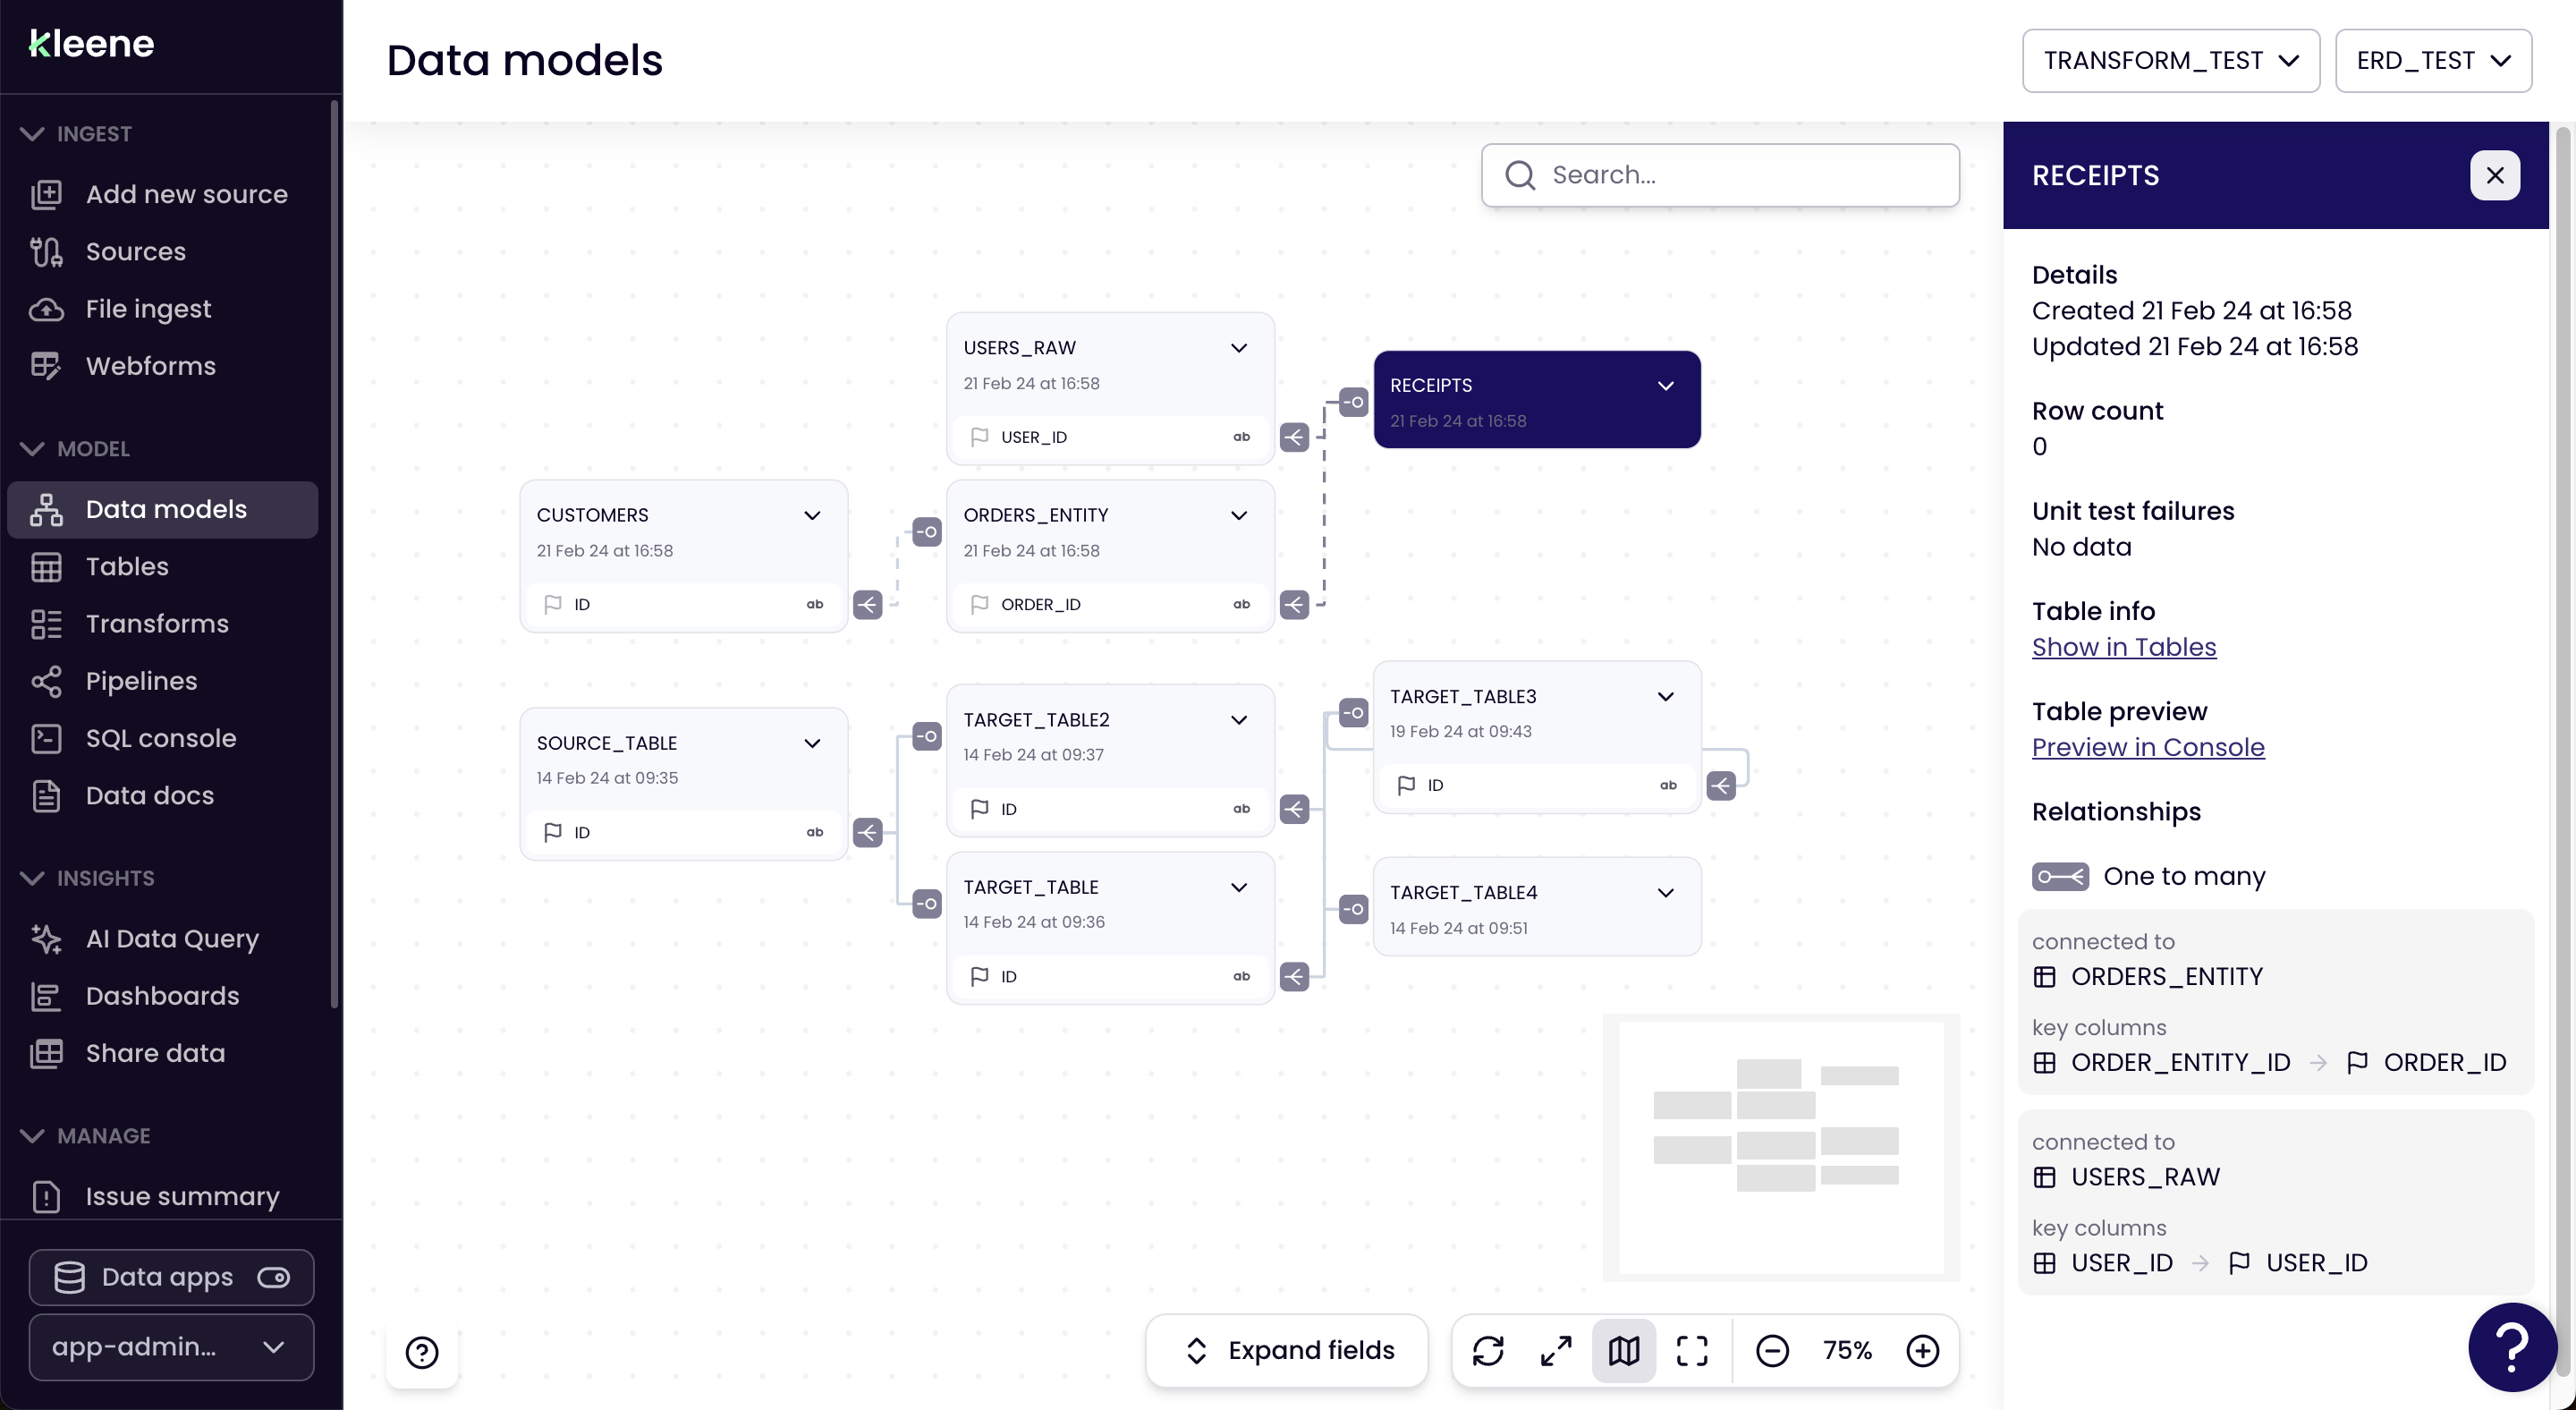
Nodes
Each node in the ERD is a table within the warehouse. The name of the table and the timestamp when the table was last updated is displayed.
Rows
Each row of a node within the ERD is a field of the table. The name of the field is shown along with an icon on the right side which denotes the data type of the field. If the field is set as a primary key (PK) within the warehouse (this can be done with the use of a constraint) it will be highlighted in navy as shown in the example above with the client_id field within the CLIENTS_ENTITY table .
Solid Lines
Any foreign key relationship that has been established between two fields across separate tables in the warehouse is represented by a solid green line. In the example this is the case for client_id within the CLIENTS_ENTITY and the same field within CLIENT_DEALS_ENTITY. At the terminal between the table (node) and the relationship (line) there is an icon which indicates the cardinality of the relationship. A key of these cardinalities can be seen by clicking on the question mark.
For instructions on how to add primary and foreign key constraints to tables in your warehouse please read the relevant documentation:
Dotted Lines
If a field has been given the same name as another in the schema and the name is suffixed with _id we will infer this as a foreign key relationship and represent this in the ERD a dotted line.
Working with the ERD
Navigation
Navigate around the ERD by clicking on a space and dragging. To zoom in and out you can either pinch on the trackpad, scroll with the mouse or use the zoom options at the bottom right of the page. Tables can be reorganised by clicking them and dragging them to a new location. At the bottom right of the screen are a number of options alongside zoom these are:
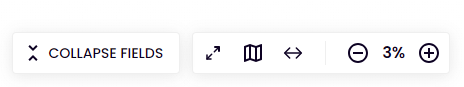
- Collapse/Expand Fields: This will collapse/expand every table such that the fields aren't/are visible. Collapsing all the fields will position the tables closer together.
- Diagonal Arrows: Change to full screen view. This is particularly useful if you have many tables within a schema and work on a large screen.
- Map: Gives a mini map of the ERD. This is particularly useful when you are zoomed in.
- Horizontal Arrows: Returns to the centre of the ERD and zooms out to a view where all tables are visible.
Choosing the schema
The dropdown menus in the top-right corner of the screen are used to choose the database and schema of the warehouse. These dropdowns are both single select meaning it is only possible to load the ERD for a single schema at any given time.
Search
The search bar in the top left of the screen can be used to search for a specific table or field name. As you start typing any table name or field name the matches the pattern entered will be displayed in a suggestions box beneath the search bar as shown in the example above.
Selecting items
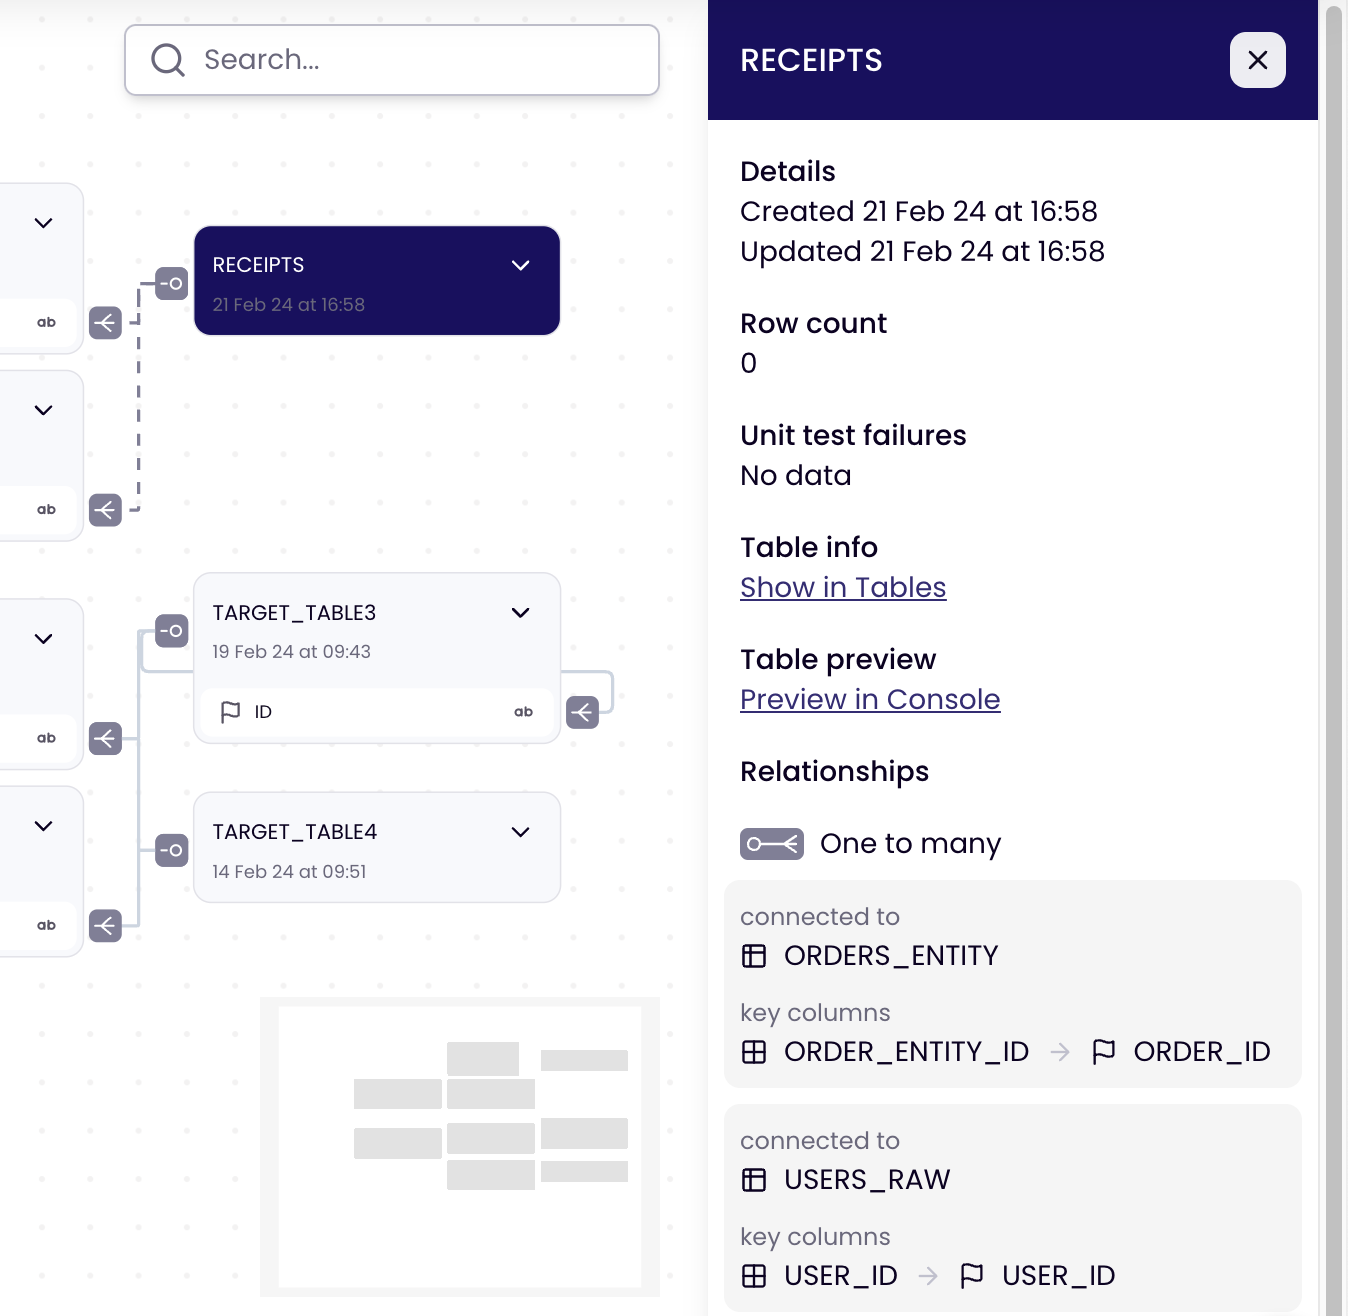
Selecting a table will highlight it with a darker colour and reduce the opacity of the relationship lines such that they are more visible. On the right-hand side of the page a sidebar will appear displaying details of the table and the relationships. It is also possible to select a field within a table, doing so will highlight the filed in green and display information about relationships this field has.
Updated 8 months ago