
Table Info
Detailed information about the chosen table in the warehouse.
Introduction
The Table Info page provides detailed information about the chosen table in the warehouse. Each of the sections outlined below provide different information about the table that is useful for data exploration and issue diagnosis without the need to execute lots of SQL queries.
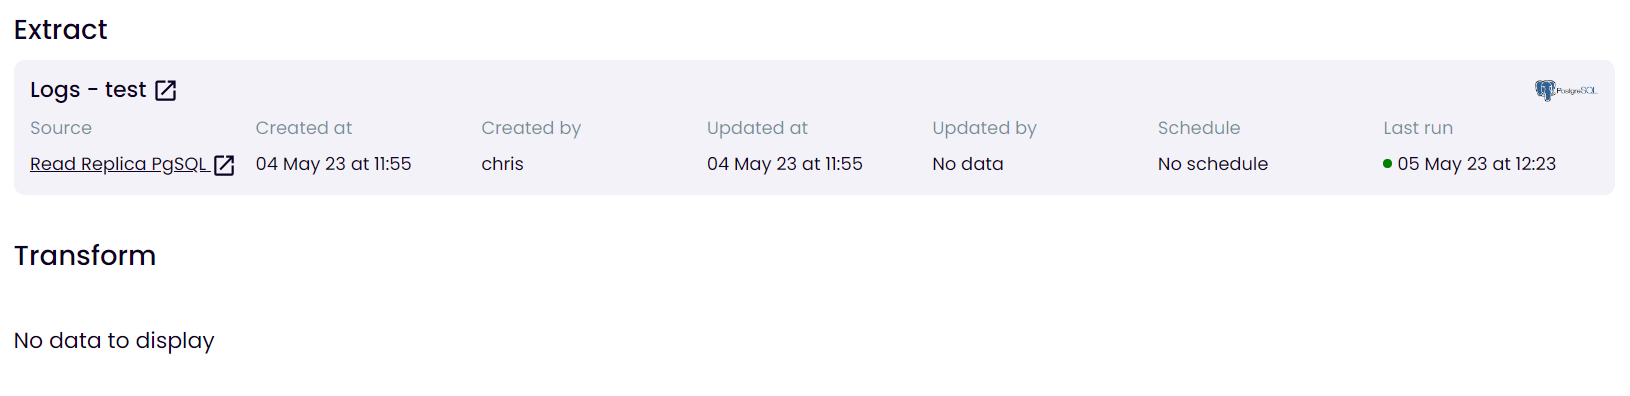
Extract and Transform
If the table is the destination table of any extract or is an output table of any transform information about that extract/transform is presented in the appropriate section. The name of the extract/transform is a link which if clicked will open in a new tab, so too is the source/transform group.
Query and Table Preview
Clicking the SQL console will open the SQL console in a new tab with a select statement of the specified table pre-populated. For example if you were on the table info page for APOLLO_22_NEW the SQL statement would be:
SELECT * FROM "QA_DEV"."INGEST"."APPOLLO_22_NEW"
A preview of 100 rows of the whole table is displayed within the section Table Preview. This table can be sorted and filtered using the field headers as is the case in the SQL console preview to retrieve more rows or aggregated information on the table please execute the relevant statement using the SQL console.
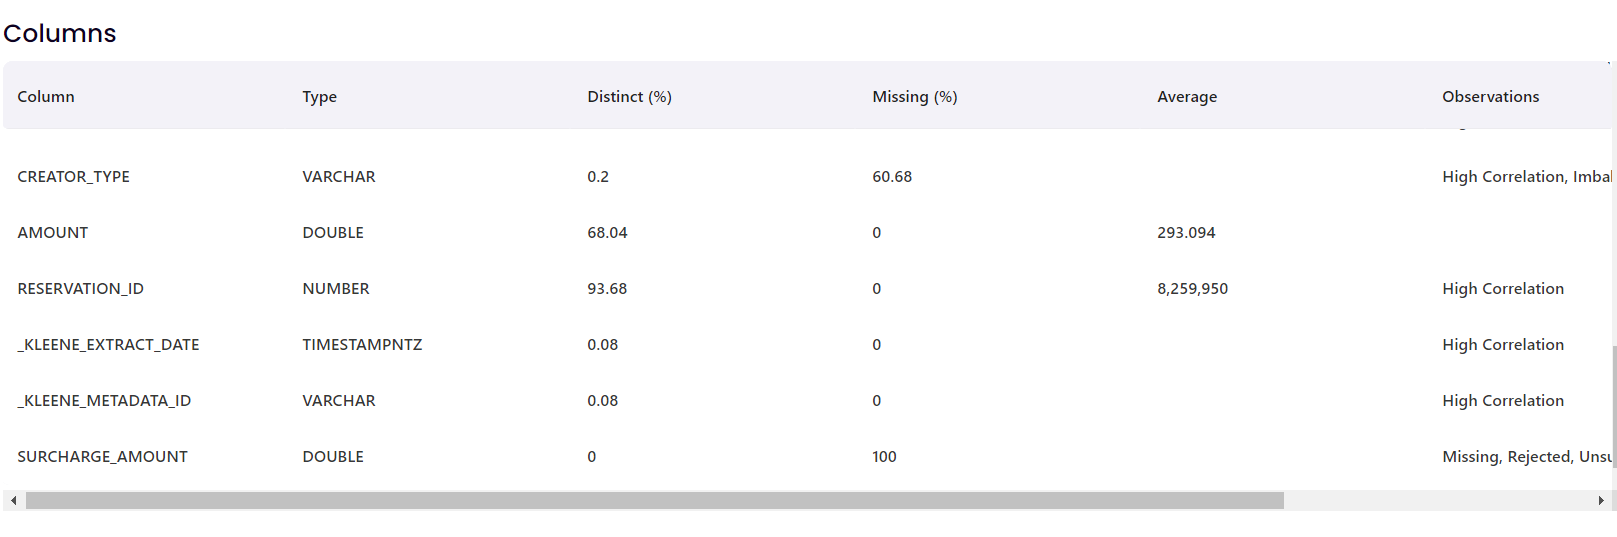
Columns
Upon the initial load of the Table Info the table name and data type is fetched. The calculated of the fields are fetched soon after and the values are based upon a random sample of 20,000 rows of the data in the table, these fields are:
- Distinct (%) - This tells you what percentage of rows with a unique value. If every row has a unique value this would be 100%.
- Missing (%) - This tells you what percentage of rows have a null value.
- Average - For any field with a numerical data type the mean will be calculated
- Observations - Based on profiling this sample some observations of this column are presented. To read ore about each observation hover over it and details are provided in the tooltip.
- Distribution - This is a histogram of the values within the column to give an understanding on the spread and skew of the values within the column.
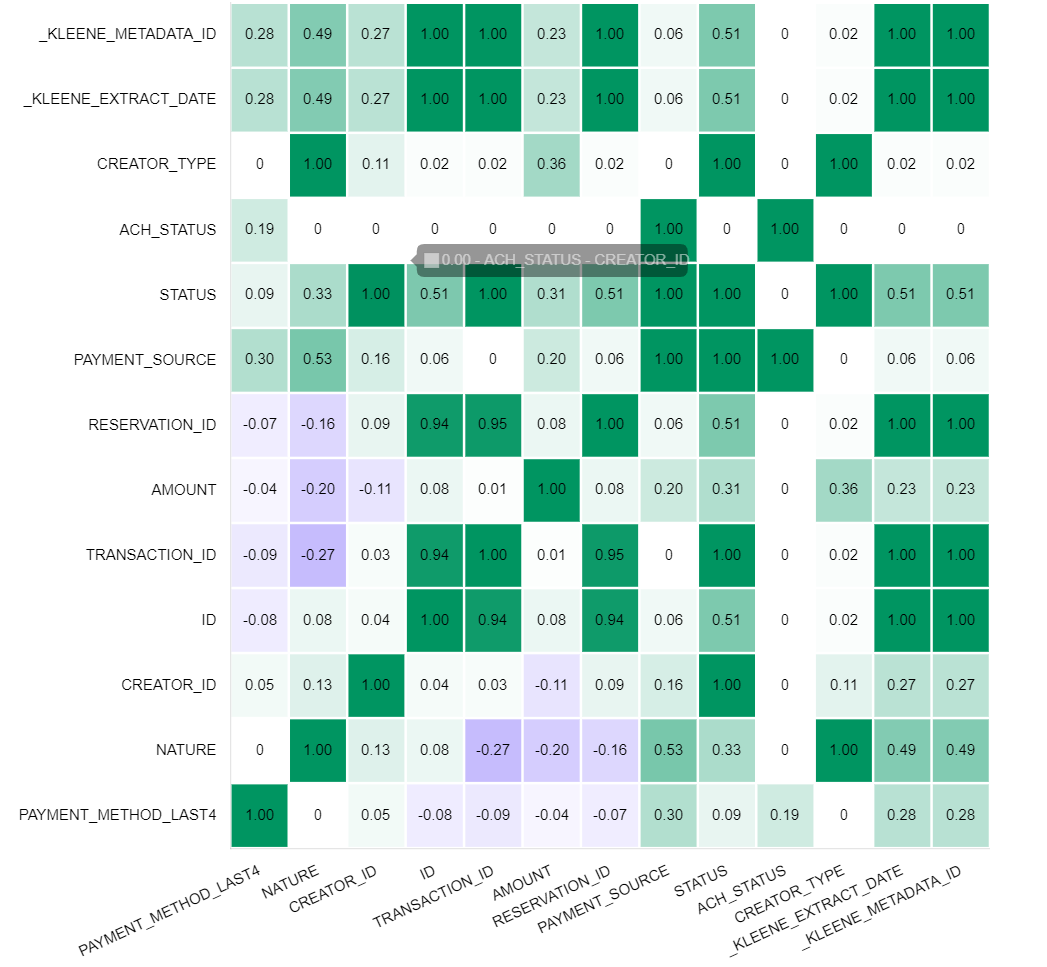
Correlation Matrix
The shade of colour indicates the strength of correlation. The sign of the correlation is determined by the colour, green is positive correlation and purple is negative correlation. The correlation matrix is only calculated for numeric columns. A tooltip with the value and the field names appears whenever you hover over any cell in the matrix.
Unit Test Results
The most recent 100 unit test results are shown at the bottom of the Table Info screen. The results are sorted with the most recent (based on TEST_TIMESTAMP) at the top. Just like the table preview the results can be sorted and filtered from the field header.
Updated 5 months ago